Free Access
Fig. 2.
Download original image
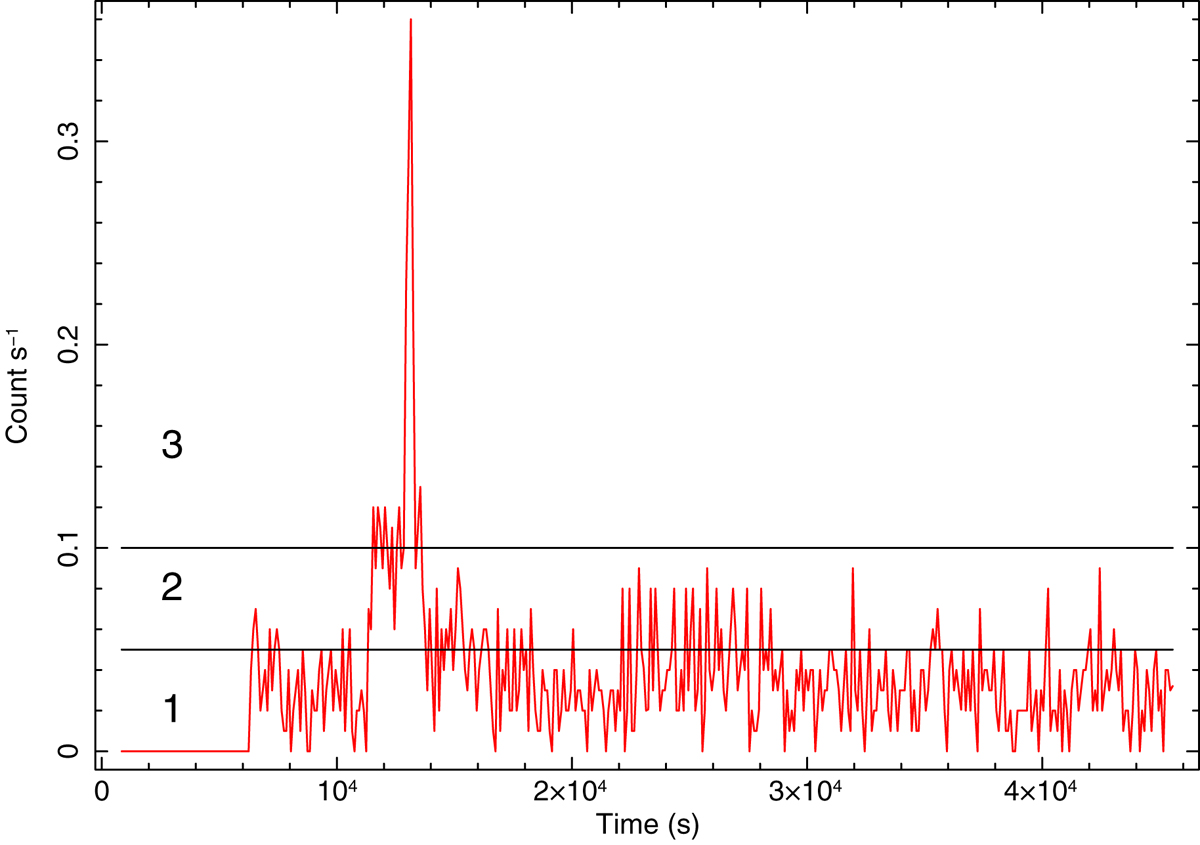
Source light curve (EPIC pn, 1–10 keV, not background subtracted, bin time = 100 s), where the horizontal lines mark the three count rate intervals adopted for the intensity selected spectroscopy: interval 1 (lowest state), 2 (intermediate state), and 3 (the faint flare).
Current usage metrics show cumulative count of Article Views (full-text article views including HTML views, PDF and ePub downloads, according to the available data) and Abstracts Views on Vision4Press platform.
Data correspond to usage on the plateform after 2015. The current usage metrics is available 48-96 hours after online publication and is updated daily on week days.
Initial download of the metrics may take a while.