Fig. 8.
Download original image
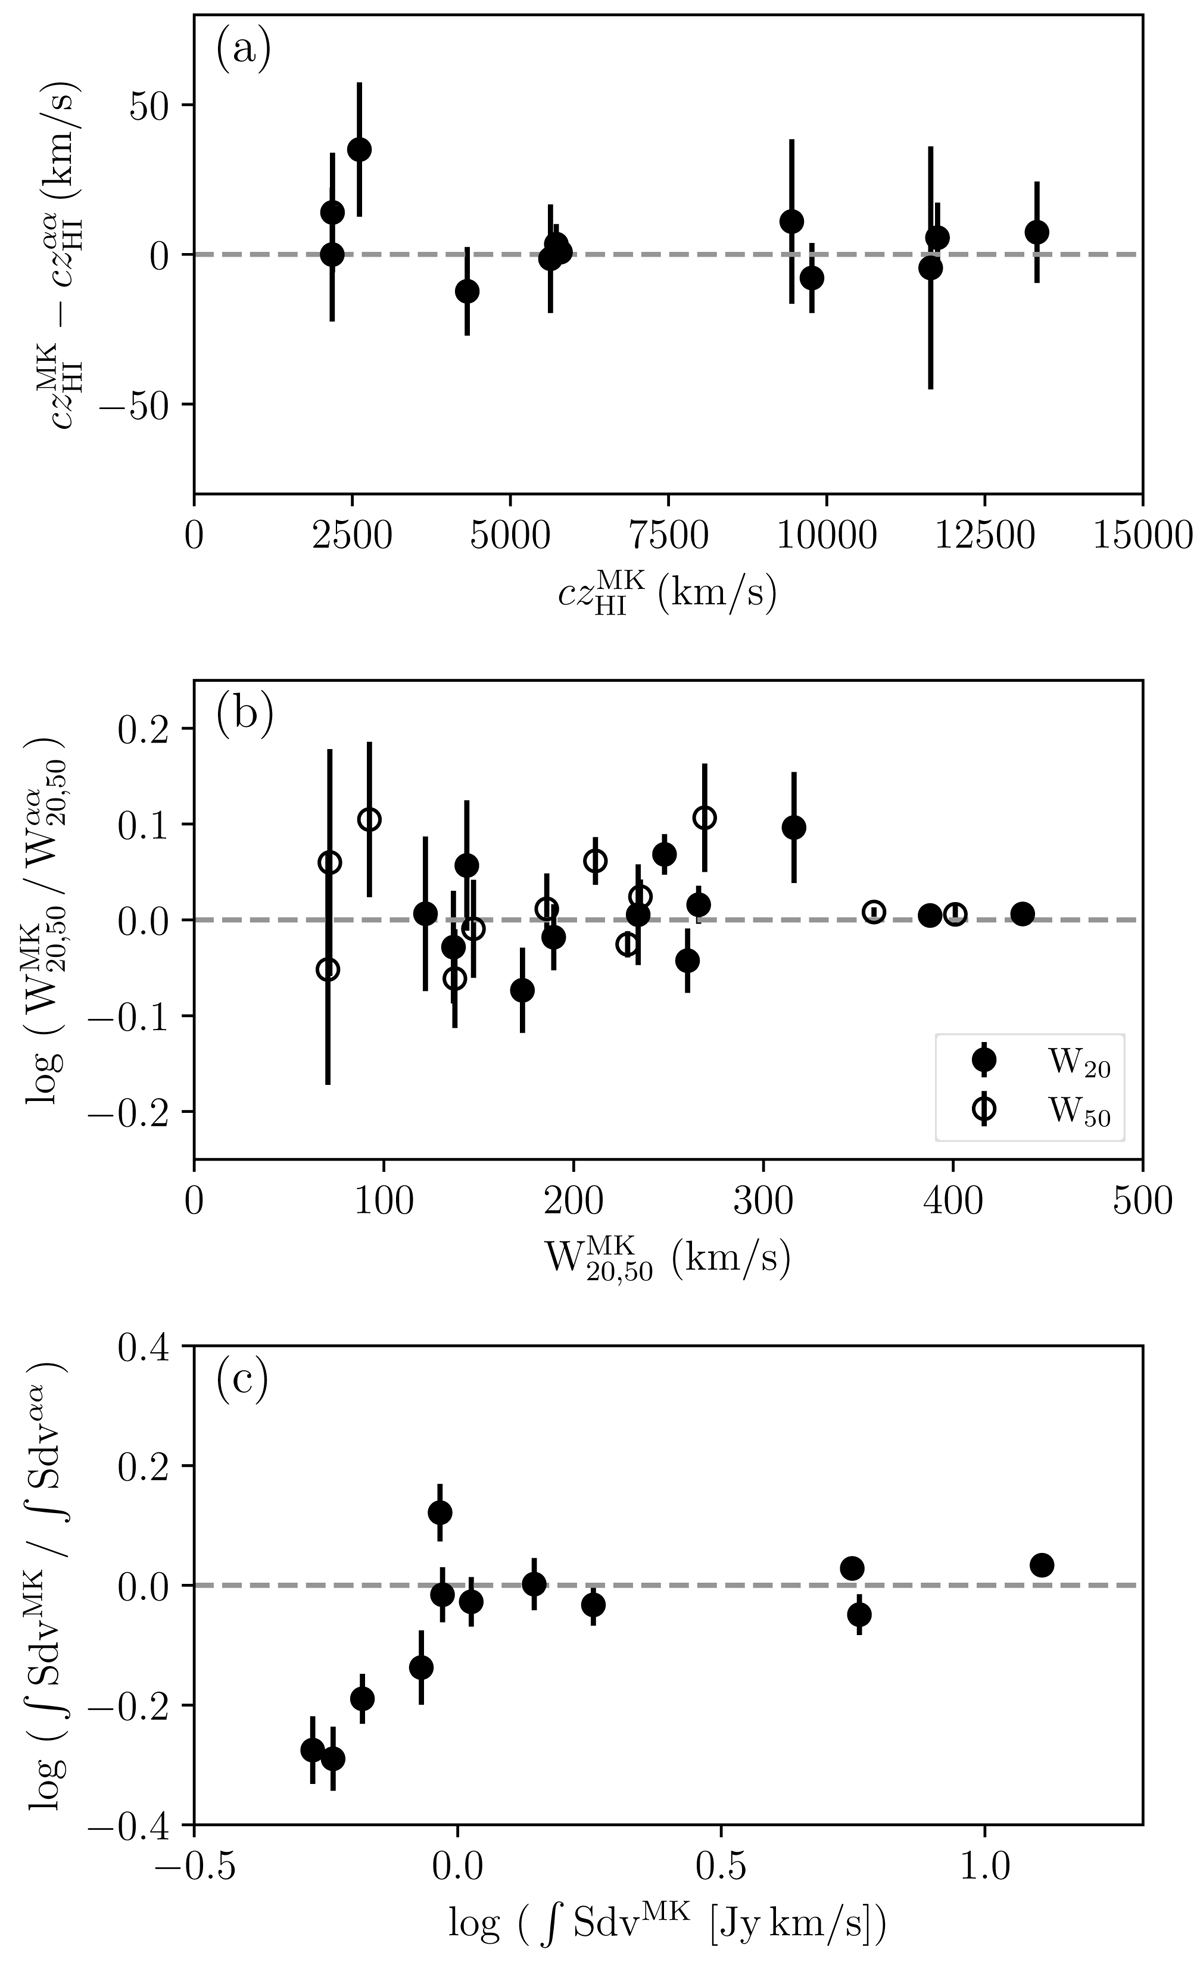
Comparison between measured properties from the global profiles of galaxies in both the MeerKAT and ALFALFA surveys. (a) the difference between the recessional velocities calculated from the H I redshifts. (b) the log ratio of the line widths, open circles represent the W50 and filled circles represent the W20. (c) log ratio of the integrated flux densities.
Current usage metrics show cumulative count of Article Views (full-text article views including HTML views, PDF and ePub downloads, according to the available data) and Abstracts Views on Vision4Press platform.
Data correspond to usage on the plateform after 2015. The current usage metrics is available 48-96 hours after online publication and is updated daily on week days.
Initial download of the metrics may take a while.