Fig. 6.
Download original image
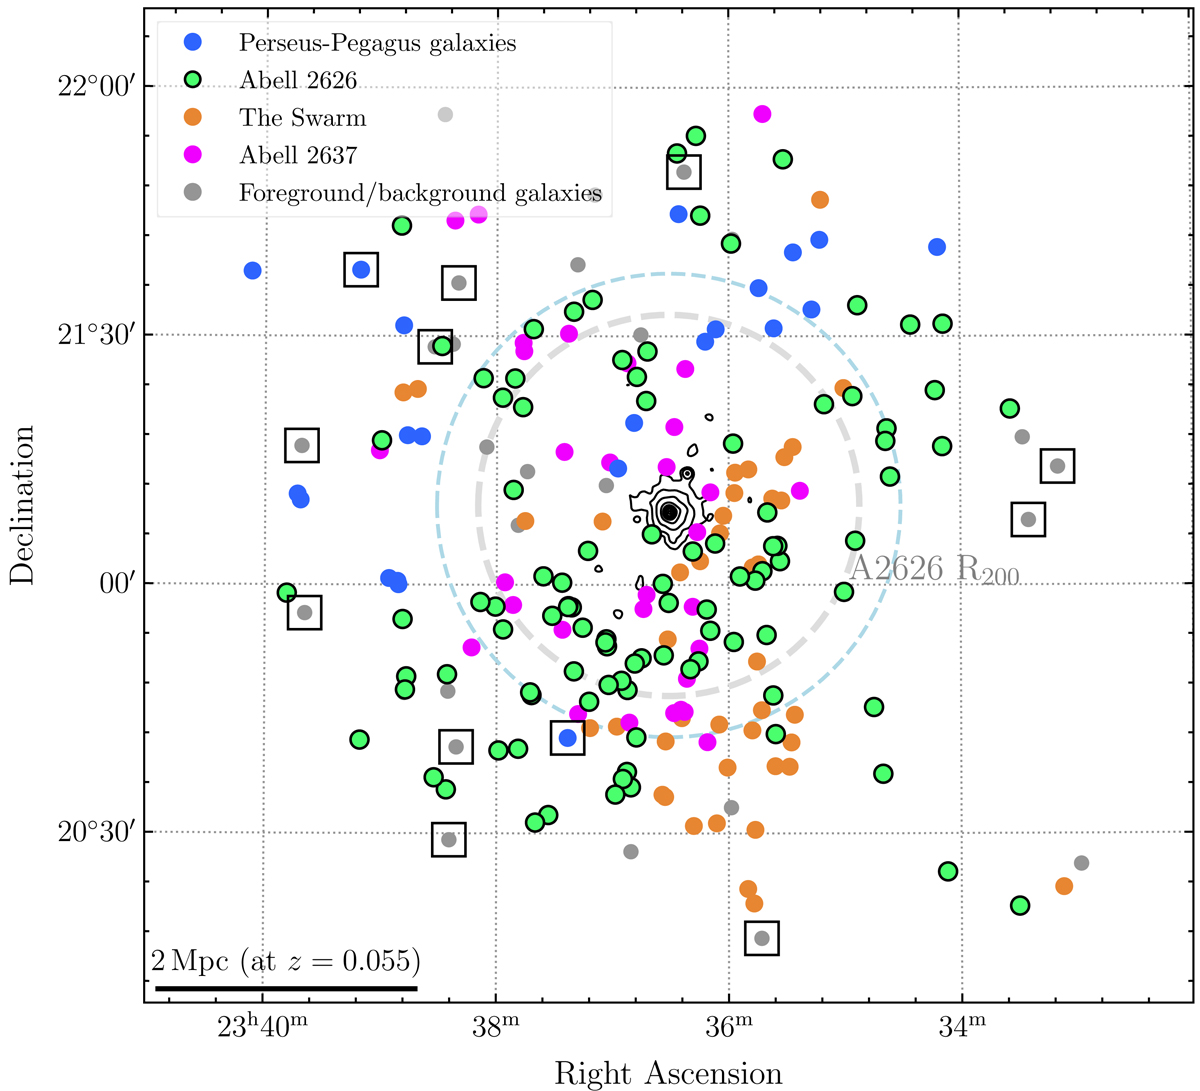
Sky distribution of the H I detections identified with SoFiA. The inner dashed grey circle represents the R200 of A2626, and the outer light blue dashed circle represents the primary beam FWHM at the frequency of the cluster. The black contours represent the x-ray emission from A2626 taken from ROSAT images. The data points representing the H I detections are coloured by the spectral over-density of which they are a member. The blue indicates likely Perseus-Pegasus filament galaxies (0.035 < z < 0.0425), green are A2626 galaxies (0.0475 < z < 0.0615), orange are galaxies in The Swarm (0.0615 < z < 0.0675), and magenta galaxies represent galaxies part of A2637 (0.0675 < z < 0.0745); see Sect. 7 for more details. The open squares represent the galaxies also detected by ALFALFA that are used in the H I flux density comparison in Sect. 5.1.
Current usage metrics show cumulative count of Article Views (full-text article views including HTML views, PDF and ePub downloads, according to the available data) and Abstracts Views on Vision4Press platform.
Data correspond to usage on the plateform after 2015. The current usage metrics is available 48-96 hours after online publication and is updated daily on week days.
Initial download of the metrics may take a while.