Fig. 3.
Download original image
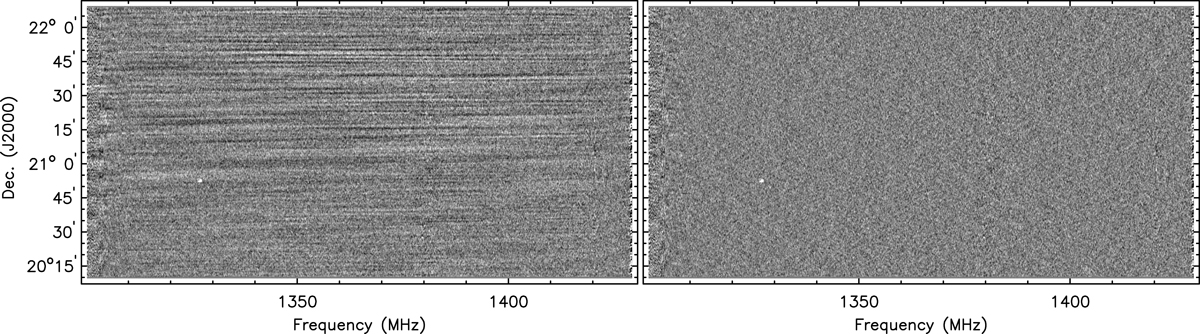
Vertical slice through the dirty data cube, smoothed to an angular resolution of 30″, taken at RA = 23:38:14.65 covering 2 degrees in declination and the full bandwidth. Left: significant spectral ripples are clearly visible after subtracting the continuum model used for self-calibration, hampering faint source detection. Right: illustration of the effectiveness of subtracting an iteratively fitted spline function of order 15 from each spectrum, resulting in uniform noise. H I emission from a galaxy can be observed in the bottom-left quadrant of this position-velocity slice.
Current usage metrics show cumulative count of Article Views (full-text article views including HTML views, PDF and ePub downloads, according to the available data) and Abstracts Views on Vision4Press platform.
Data correspond to usage on the plateform after 2015. The current usage metrics is available 48-96 hours after online publication and is updated daily on week days.
Initial download of the metrics may take a while.