Fig. 11.
Download original image
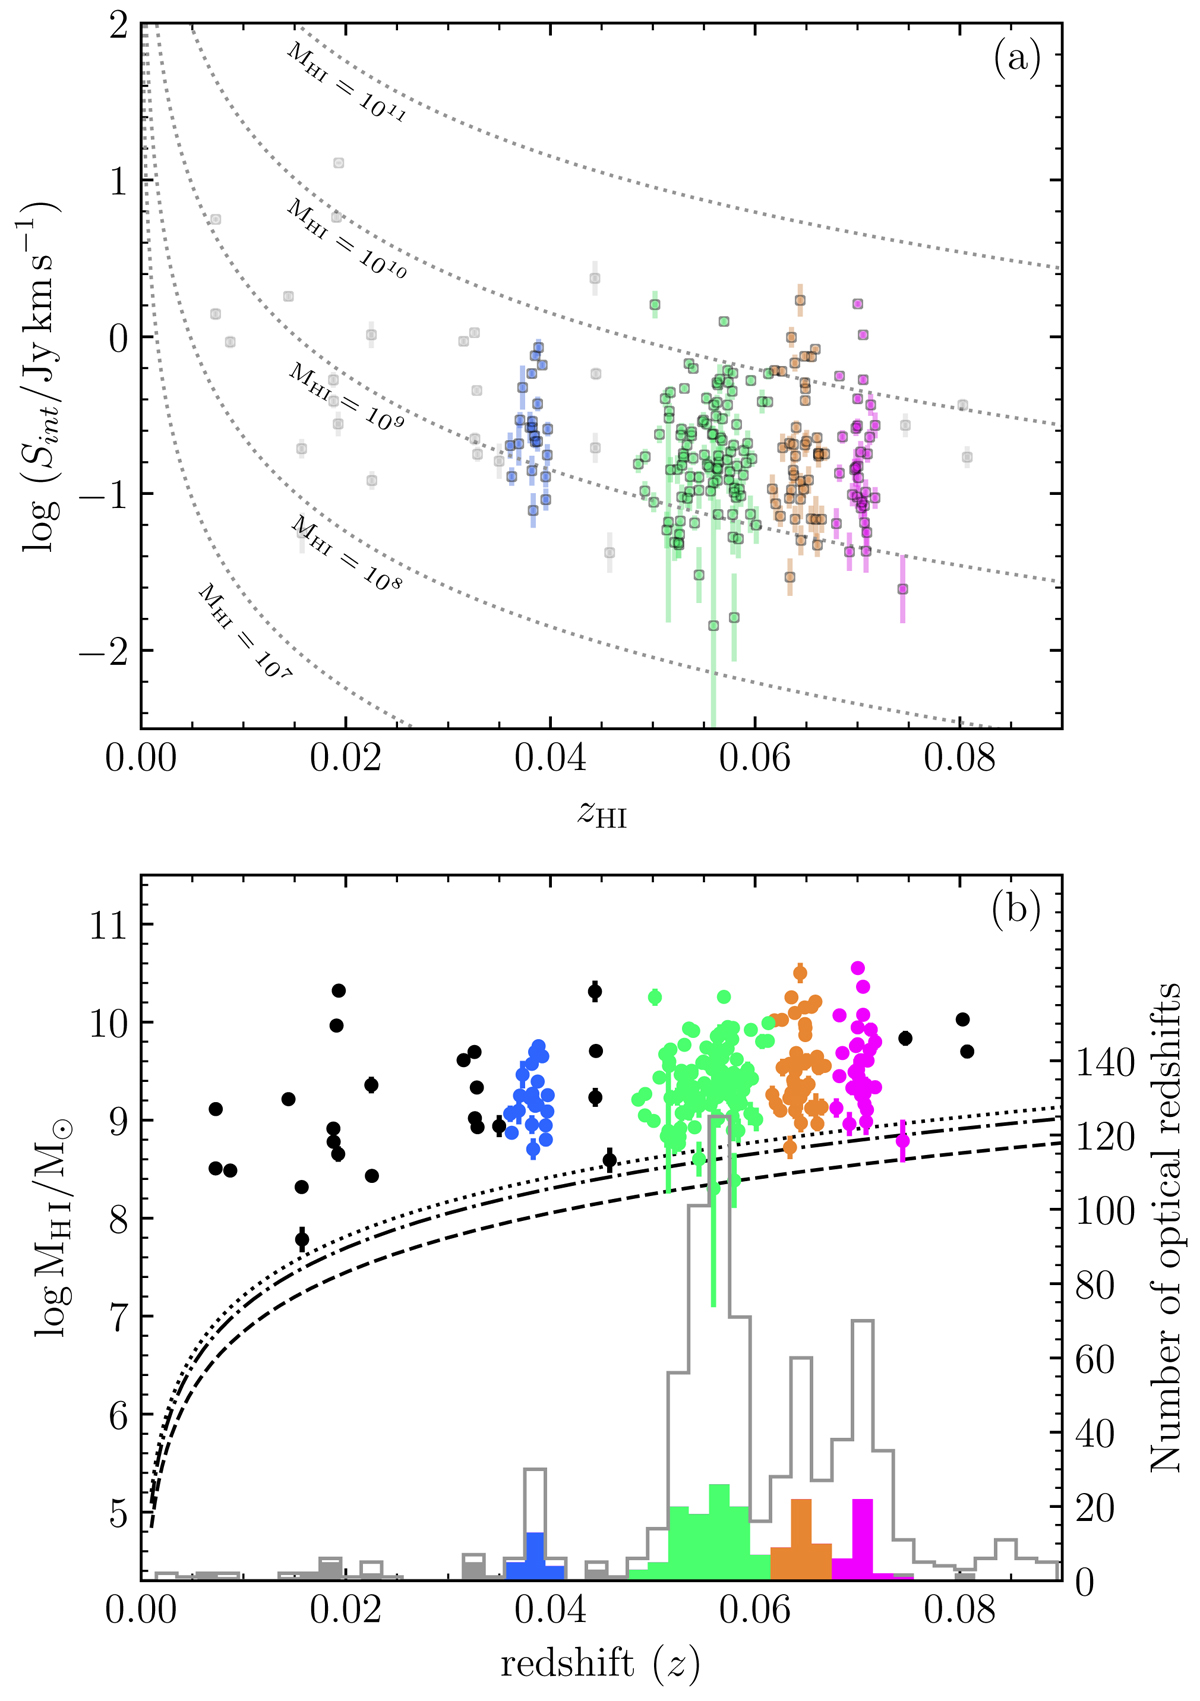
(a) Integrated flux versus redshift. The dotted lines show lines of constant H I mass. (b) Measured H I mass as a function of redshift. The coloured round data points in both panels indicate the 219 H I detections; the colours correspond to the spectral over-densities highlighted in the histogram in panel b, and the black data points correspond to the grey histograms that include sources not associated with any over-density. The light grey open histogram represents the optical redshift catalogue from Healy et al. (2021). The dashed grey lines indicate the 5σ H I mass limits at the three velocity resolutions used in the source finding: dashed for 45 km s−1, dot-dashed for 135 km s−1, and dotted for 225 km s−1.
Current usage metrics show cumulative count of Article Views (full-text article views including HTML views, PDF and ePub downloads, according to the available data) and Abstracts Views on Vision4Press platform.
Data correspond to usage on the plateform after 2015. The current usage metrics is available 48-96 hours after online publication and is updated daily on week days.
Initial download of the metrics may take a while.