Fig. 10.
Download original image
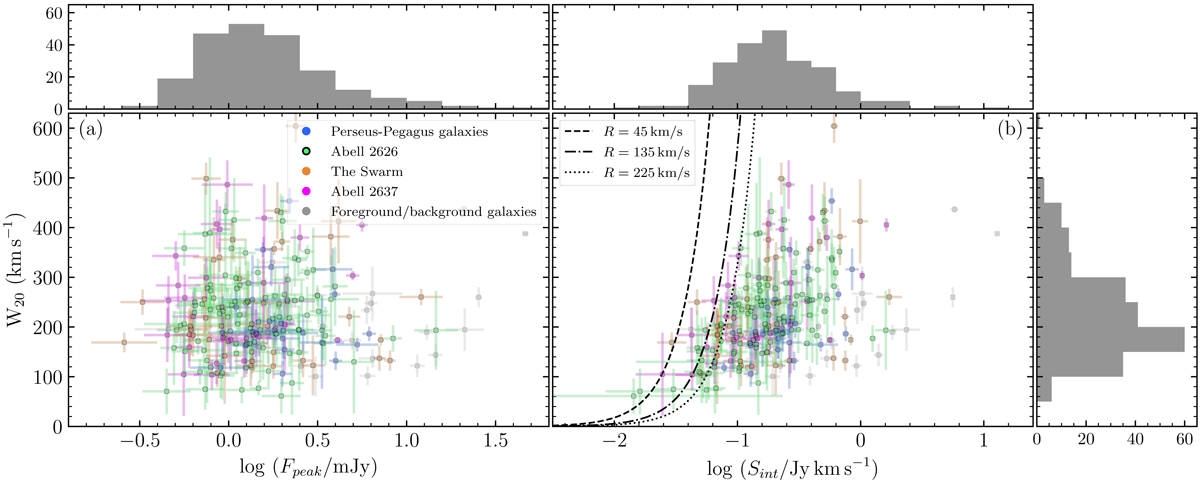
Bivariate distributions of measured properties from the global H I profiles of the H I detected sources. Peak flux density (a) and integrated flux density (b) as a function of W20 line width, derived from the global H I profiles. The detection thresholds based on the three velocity smoothing kernels used for the source-finding are represented by the black lines in Fig. 10b. The colours of the data points represent the over-density to which the galaxy belongs: A2626 sources are green, The Swarm sources are orange, A2637 sources are pink, and the sources coloured blue belong to the Perseus-Pegasus filament. Grey data points are galaxies in the volume that do not belong to a spectral over-density. The histograms along the top and right side of the panels show the 1D distribution of the observable along that axis.
Current usage metrics show cumulative count of Article Views (full-text article views including HTML views, PDF and ePub downloads, according to the available data) and Abstracts Views on Vision4Press platform.
Data correspond to usage on the plateform after 2015. The current usage metrics is available 48-96 hours after online publication and is updated daily on week days.
Initial download of the metrics may take a while.