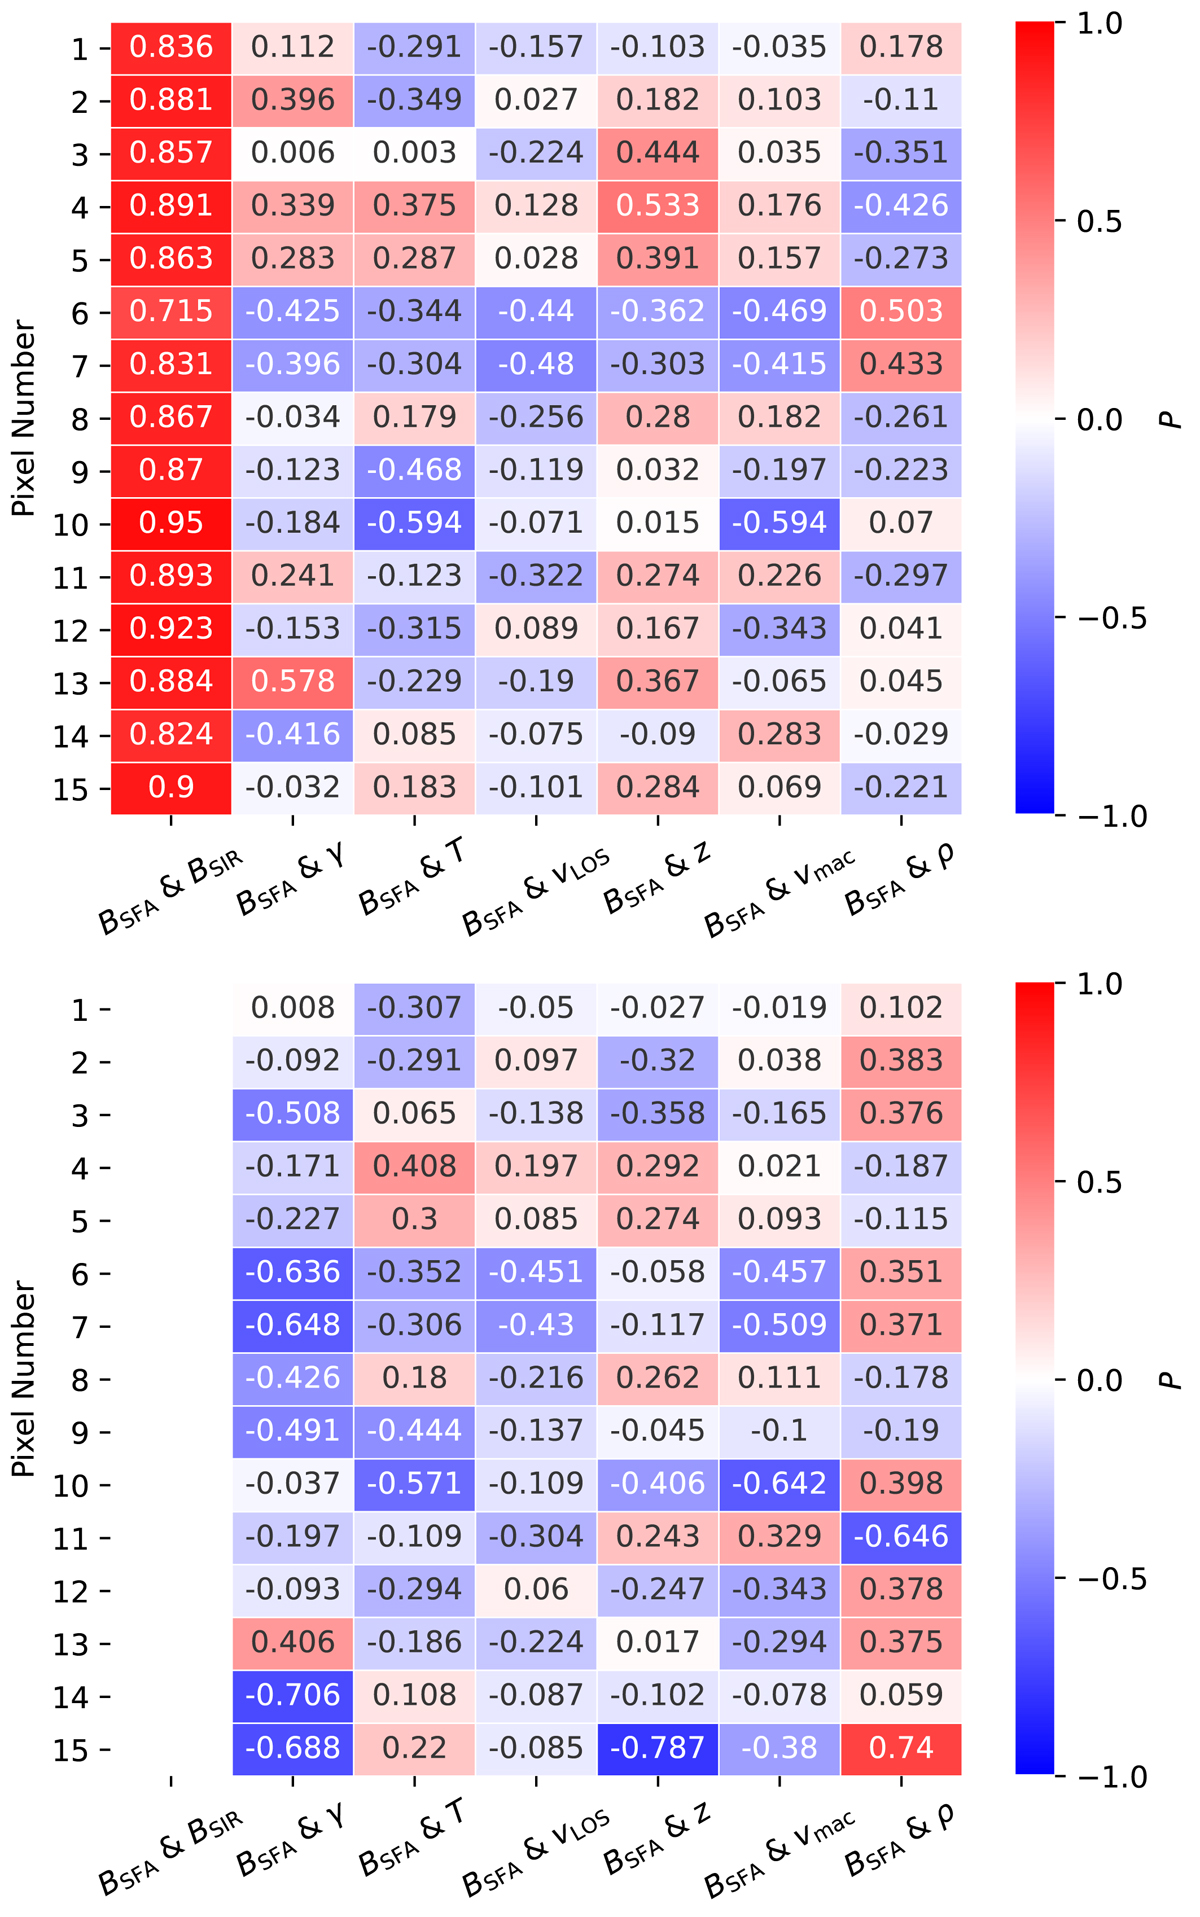
Fig. 8.
Download original image
Correlations between BSFA and parameters returned by the inversion schemes. Top panel: Pearson correlation coefficients, P, between BSFA and the values returned by the S1 inversions for every pixel in Table 2. A value of 1 indicates perfect positive correlation (red), while a value of −1 indicates perfect negative correlation (blue). A value of 0 represents complete un-correlation. Bottom panel: same but for S2 inversions, where BSIR was not included as a free parameter. The correlation between BSFA and BSIR is, therefore, undefined.
Current usage metrics show cumulative count of Article Views (full-text article views including HTML views, PDF and ePub downloads, according to the available data) and Abstracts Views on Vision4Press platform.
Data correspond to usage on the plateform after 2015. The current usage metrics is available 48-96 hours after online publication and is updated daily on week days.
Initial download of the metrics may take a while.