Fig. 6.

Download original image
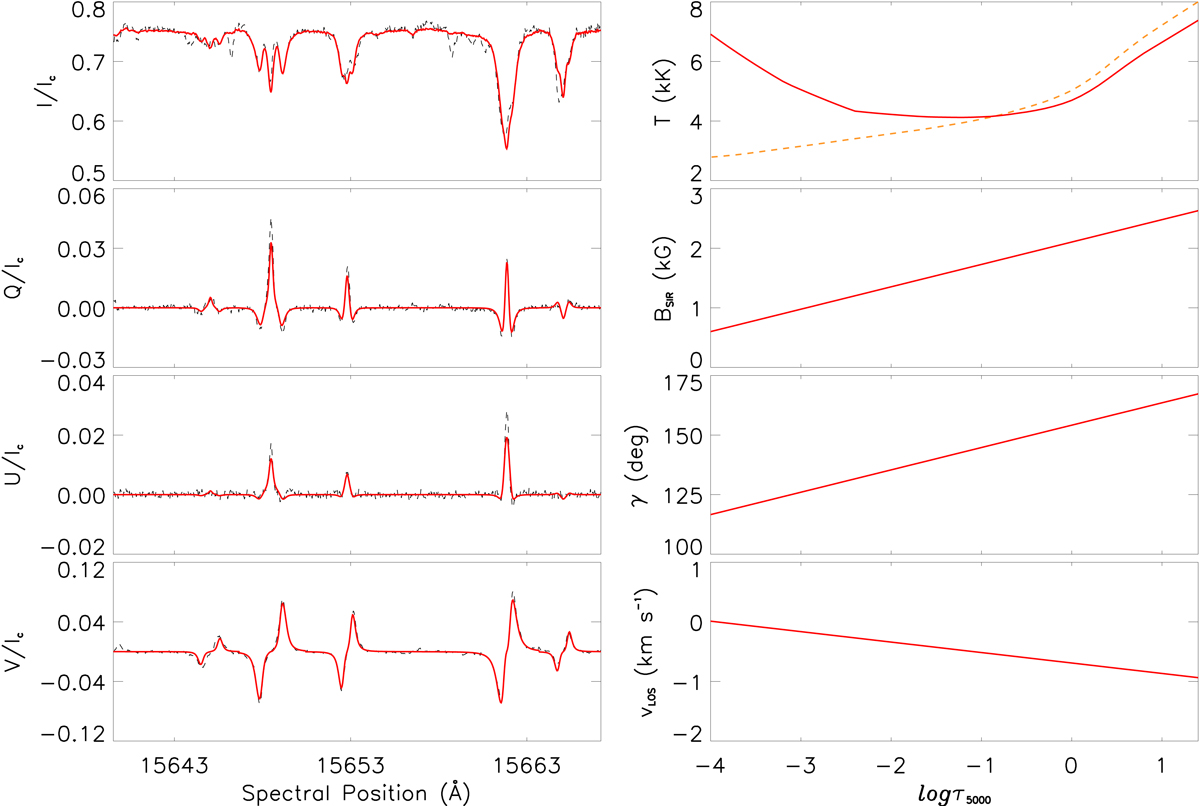
Example of an inverted atmosphere and respective atmospheric outputs. Left column: full continuum-normalised Stokes vector (I, Q, U, and Vfrom top to bottom) shown for all five spectral lines considered by the inversion scheme for Pixel 15 from Table 2 (x = 45, y = 30). The dashed black lines plot the observed spectra, and the solid red lines plot the fitted spectra returned by SIR with S1. Right column: retrieved atmospheric parameters (namely T, BSIR, γ, and vLOSfrom top to bottom) are shown as a function of log τ5000. The stratification of T in the initial hot umbral model is also shown (dashed orange line overlaid in the top right panel). The value of Φ during this inversion cycle was 96°.
Current usage metrics show cumulative count of Article Views (full-text article views including HTML views, PDF and ePub downloads, according to the available data) and Abstracts Views on Vision4Press platform.
Data correspond to usage on the plateform after 2015. The current usage metrics is available 48-96 hours after online publication and is updated daily on week days.
Initial download of the metrics may take a while.


