Fig. 5.
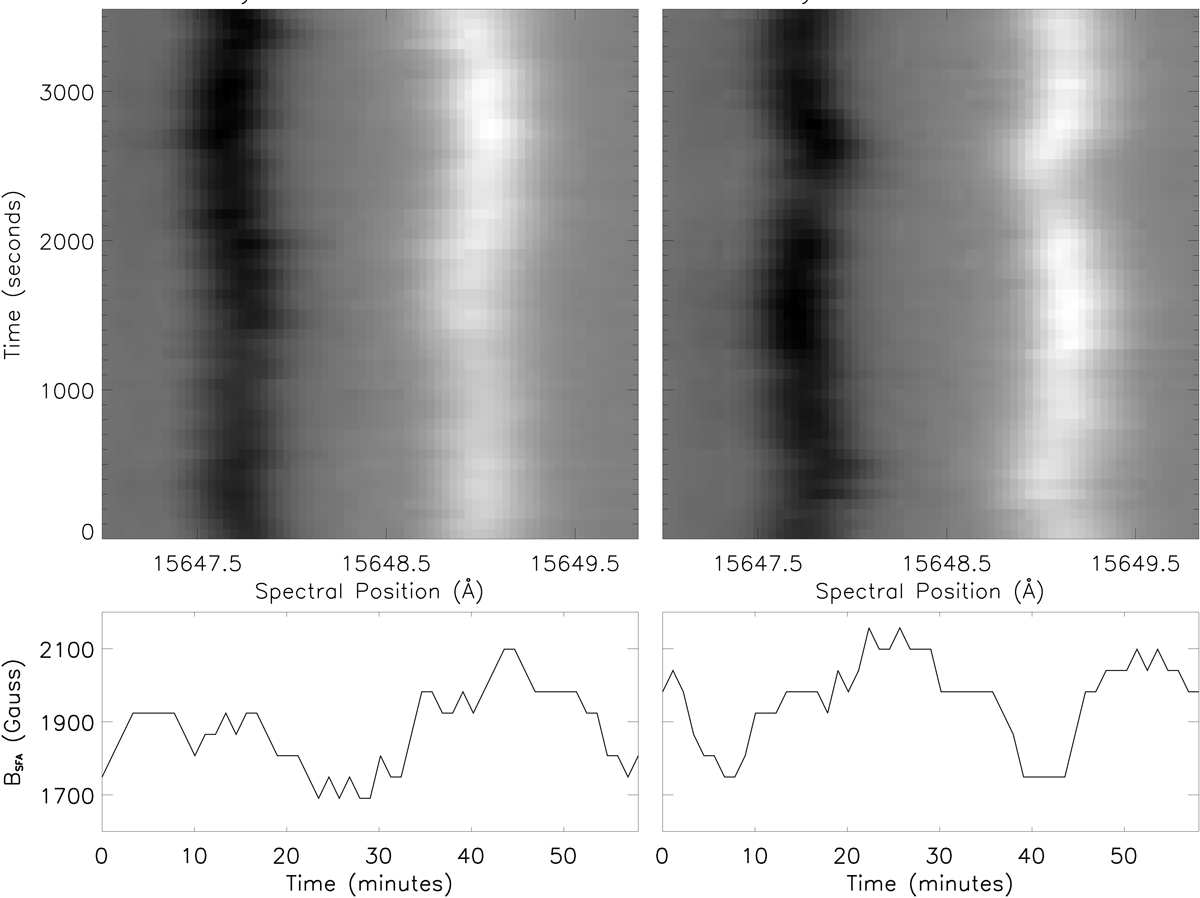
Download original image
Two examples of longer-period amplitude variations present in these data. Top panels: spectral-time plots constructed using Stokes-V data in the same spectral window as plotted in the left-hand panel of Fig. 2. Bottom panels: variation in BSFA over time calculated from the Stokes-V data plotted in the top panels. Peak-to-peak amplitude variations are measured to be more than 400 G in both of these cases.
Current usage metrics show cumulative count of Article Views (full-text article views including HTML views, PDF and ePub downloads, according to the available data) and Abstracts Views on Vision4Press platform.
Data correspond to usage on the plateform after 2015. The current usage metrics is available 48-96 hours after online publication and is updated daily on week days.
Initial download of the metrics may take a while.