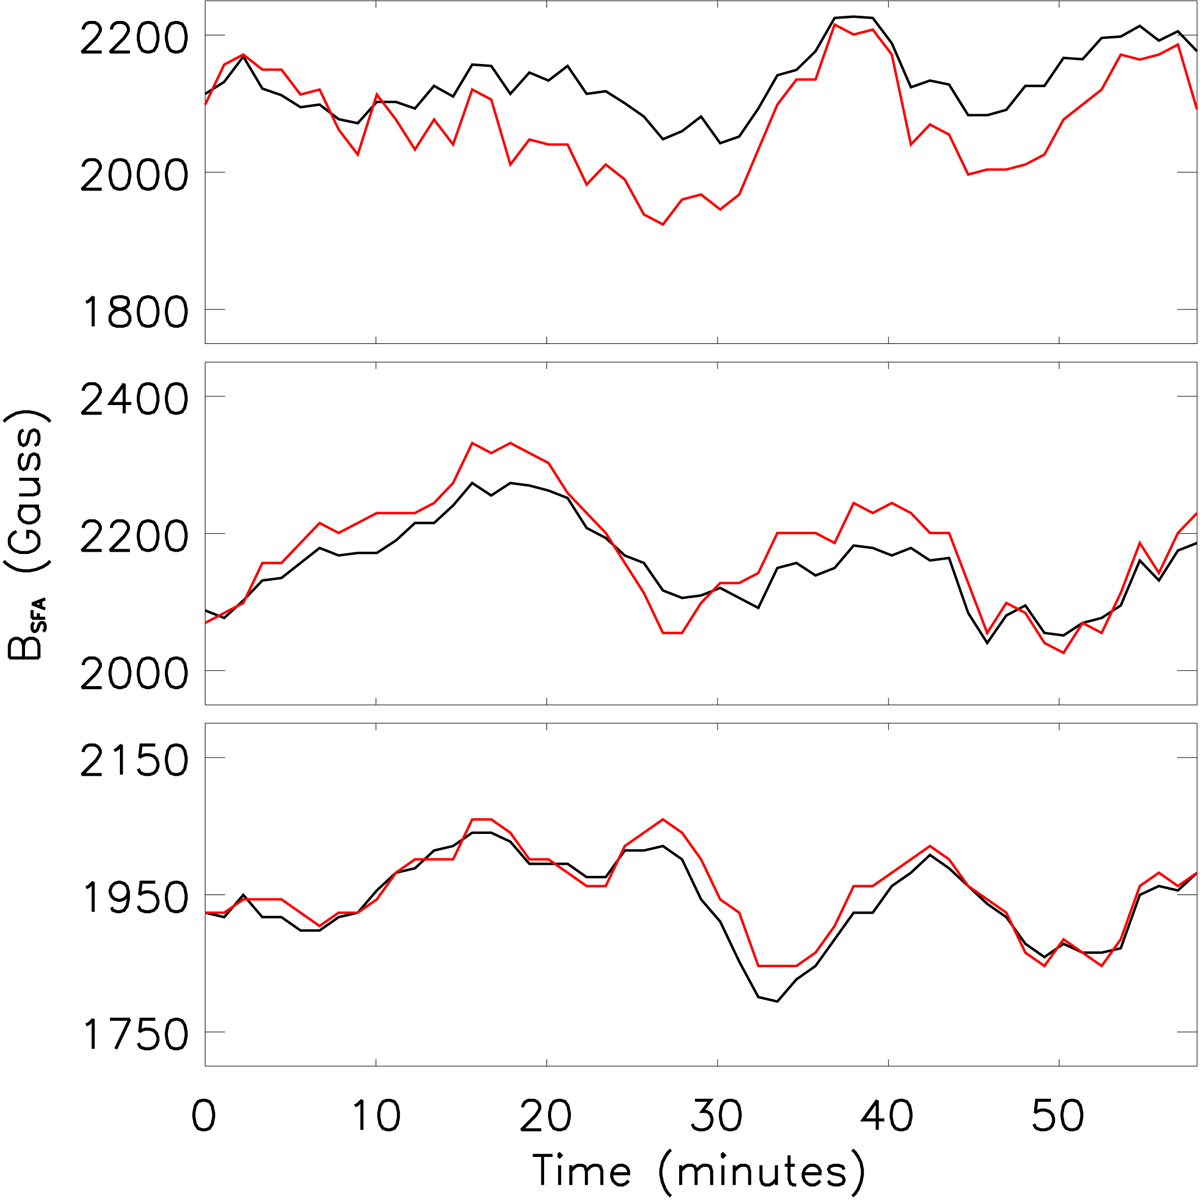
Fig. 4.
Download original image
Evolution of the LOS magnetic field strength averaged over multiple pixels for each of the upper (top panel), central (middle panel), and lower (bottom panel) red boxes overlaid in Fig. 3. The red curves plot the magnetic field averaged over the red crosses within each box, and the black curves plot the average magnetic field across the entire red box (±one pixel to either side for the central box). These apparent oscillations are clearly sustained and in phase across multiple pixels in these data.
Current usage metrics show cumulative count of Article Views (full-text article views including HTML views, PDF and ePub downloads, according to the available data) and Abstracts Views on Vision4Press platform.
Data correspond to usage on the plateform after 2015. The current usage metrics is available 48-96 hours after online publication and is updated daily on week days.
Initial download of the metrics may take a while.