Fig. 3.
Download original image
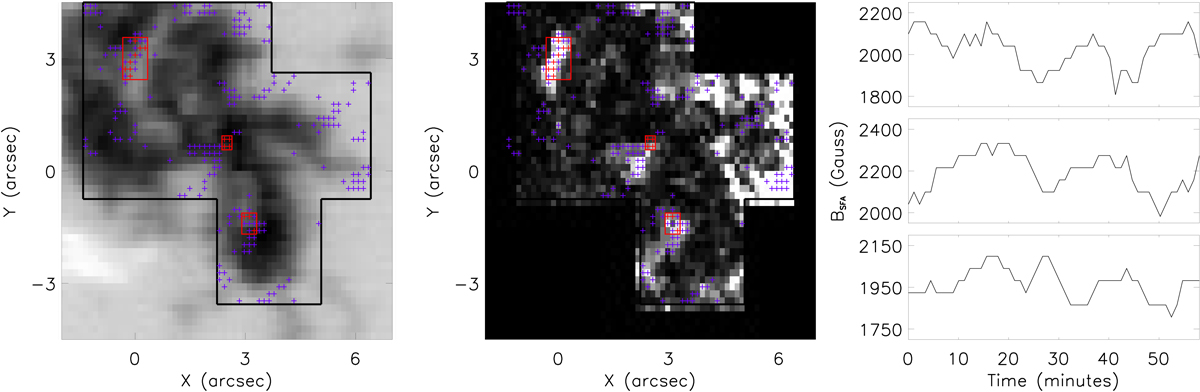
Spatial structuring of long-period oscillations within the pore. Left panel: Stokes-V map at 15 647.6 Å at the same time as plotted in Fig. 1. The black contour outlines the pixels that were analysed using the wavelet method. The red crosses indicate the 15 pixels that displayed sustained high-amplitude oscillations within the period range studied here. Purple crosses locate all other pixels that return some periodicity, albeit with either low amplitude or localised in time. The red boxes indicate the spatial regions with sustained oscillations that are studied in Sect. 3.1. Centre panel: total wavelet power within the cone-of-influence around a period of ∼931 s for each pixel within the black contour plotted in the left-hand panel. White indicates more power, with black indicating relatively low power. The three regions of sustained power studied here are immediately evident in the centre of the pore. Right panels: BSFA against time for three of the pixels indicated by the red crosses in the left-hand panel. These three pixels (Pixels 2, 9, and 15 from top to bottom; see Table 2) were selected such that one came from each of the three red boxes, with the position of the plots corresponding to the position of the boxes (top, middle, and bottom, respectively). Long-period, high-amplitude oscillations in the inferred LOS magnetic field strength are evident in each panel.
Current usage metrics show cumulative count of Article Views (full-text article views including HTML views, PDF and ePub downloads, according to the available data) and Abstracts Views on Vision4Press platform.
Data correspond to usage on the plateform after 2015. The current usage metrics is available 48-96 hours after online publication and is updated daily on week days.
Initial download of the metrics may take a while.