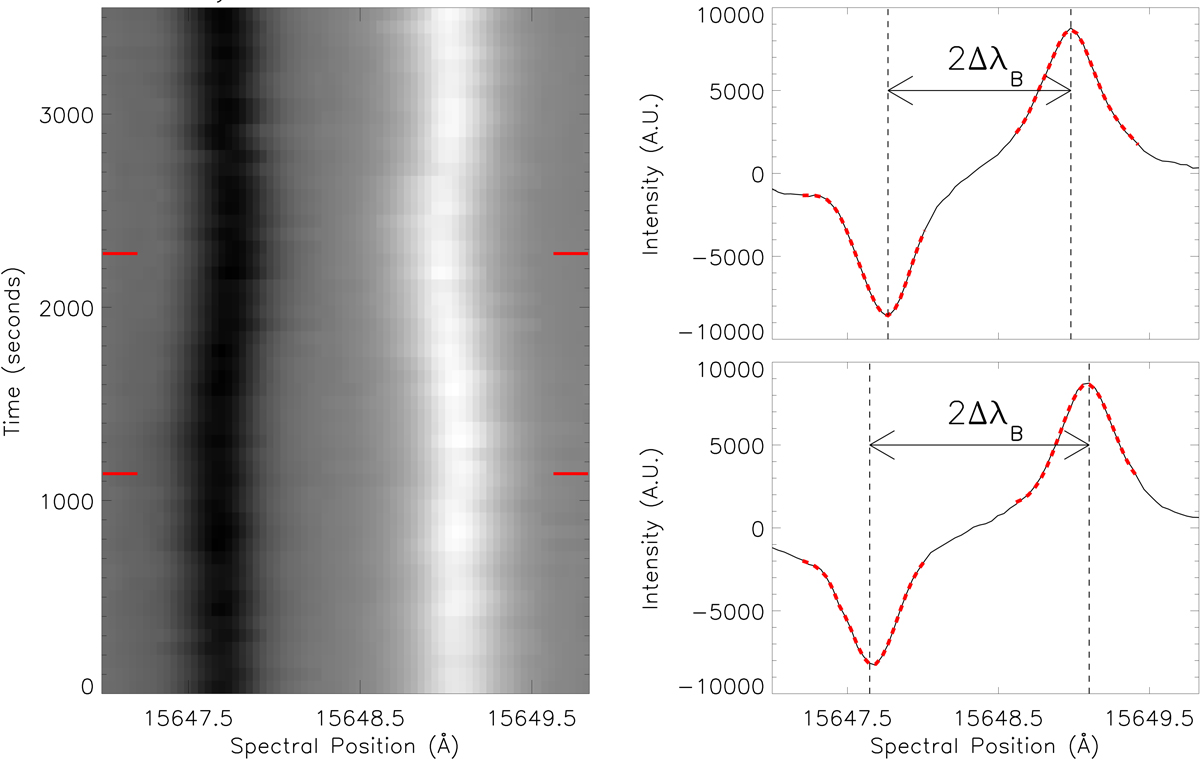
Fig. 2.
Download original image
Example spectra for a pixel within the pore. Left panel: Stokes-V spectral-time plot for a window around the Fe I 15 648.52 Å line sampled at the pixel denoted by the red cross in Fig. 1. The SFA allows us to infer the LOS magnetic field strength purely through measuring the distance between peaks of the positive and negative lobes. Right panels: Stokes-V plots measured at the locations marked by the upper (top panel) and lower (bottom panel) red tick marks overlaid in the left panel. The vertical dashed lines indicate the minima or maxima of the lobes. The dashed red curves plot the Gaussian fits, within a 0.8 Å window used to calculate the locations of the minima or maxima. The lobe widths in the top and bottom panels correspond to BSFA values of 1750 G and 2100 G, respectively.
Current usage metrics show cumulative count of Article Views (full-text article views including HTML views, PDF and ePub downloads, according to the available data) and Abstracts Views on Vision4Press platform.
Data correspond to usage on the plateform after 2015. The current usage metrics is available 48-96 hours after online publication and is updated daily on week days.
Initial download of the metrics may take a while.