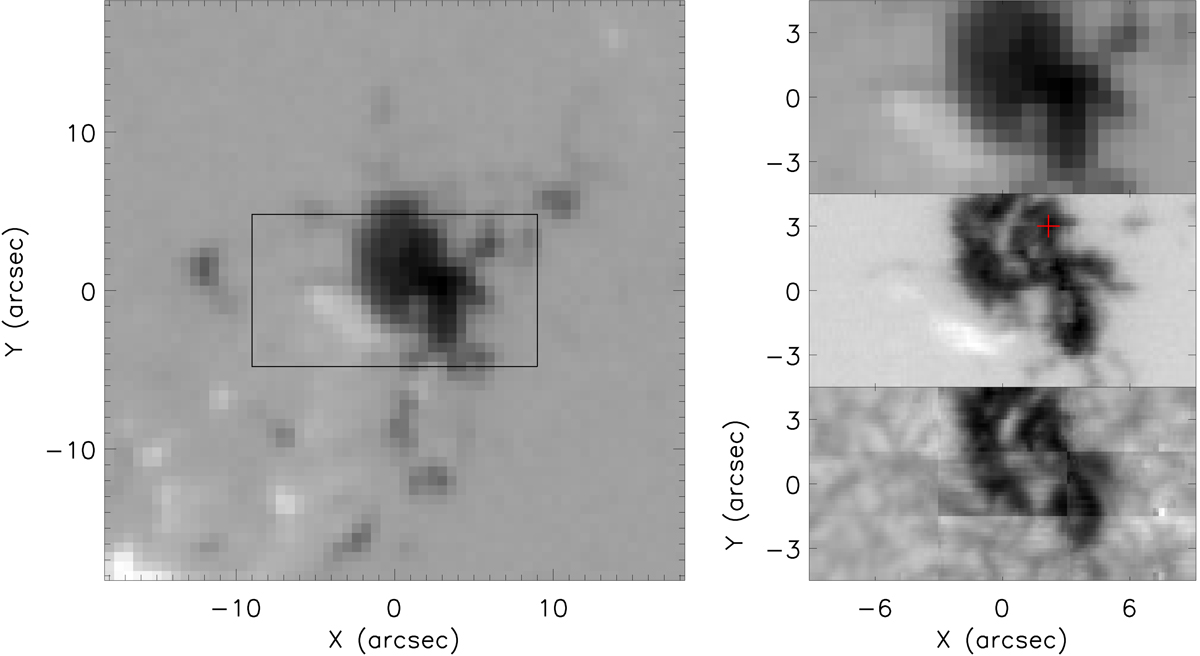
Fig. 1.
Download original image
Context image of the pore studied in this article. Left panel: a wider FOV of the active region as observed by the SDO/HMI instrument at 10:00:05 UT on 1 September 2019. The overlaid black box outlines the region plotted in the other panels. Right panels: total FOV of the GRIS instrument is plotted in three different diagnostics: The top row plots a magnetogram returned by the SDO/HMI instrument; the middle row plots the Stokes-V component sampled by GRIS at 15 647.6 Å; and the bottom row plots the Stokes-I intensity in the continuum at a wavelength position of 15 646.8 Å. The scan that sampled the GRIS images was started at 10:00:01 UT. Artefacts of the stitching process can be seen in the continuum image. The red cross indicates the pixel discussed in Fig. 2.
Current usage metrics show cumulative count of Article Views (full-text article views including HTML views, PDF and ePub downloads, according to the available data) and Abstracts Views on Vision4Press platform.
Data correspond to usage on the plateform after 2015. The current usage metrics is available 48-96 hours after online publication and is updated daily on week days.
Initial download of the metrics may take a while.