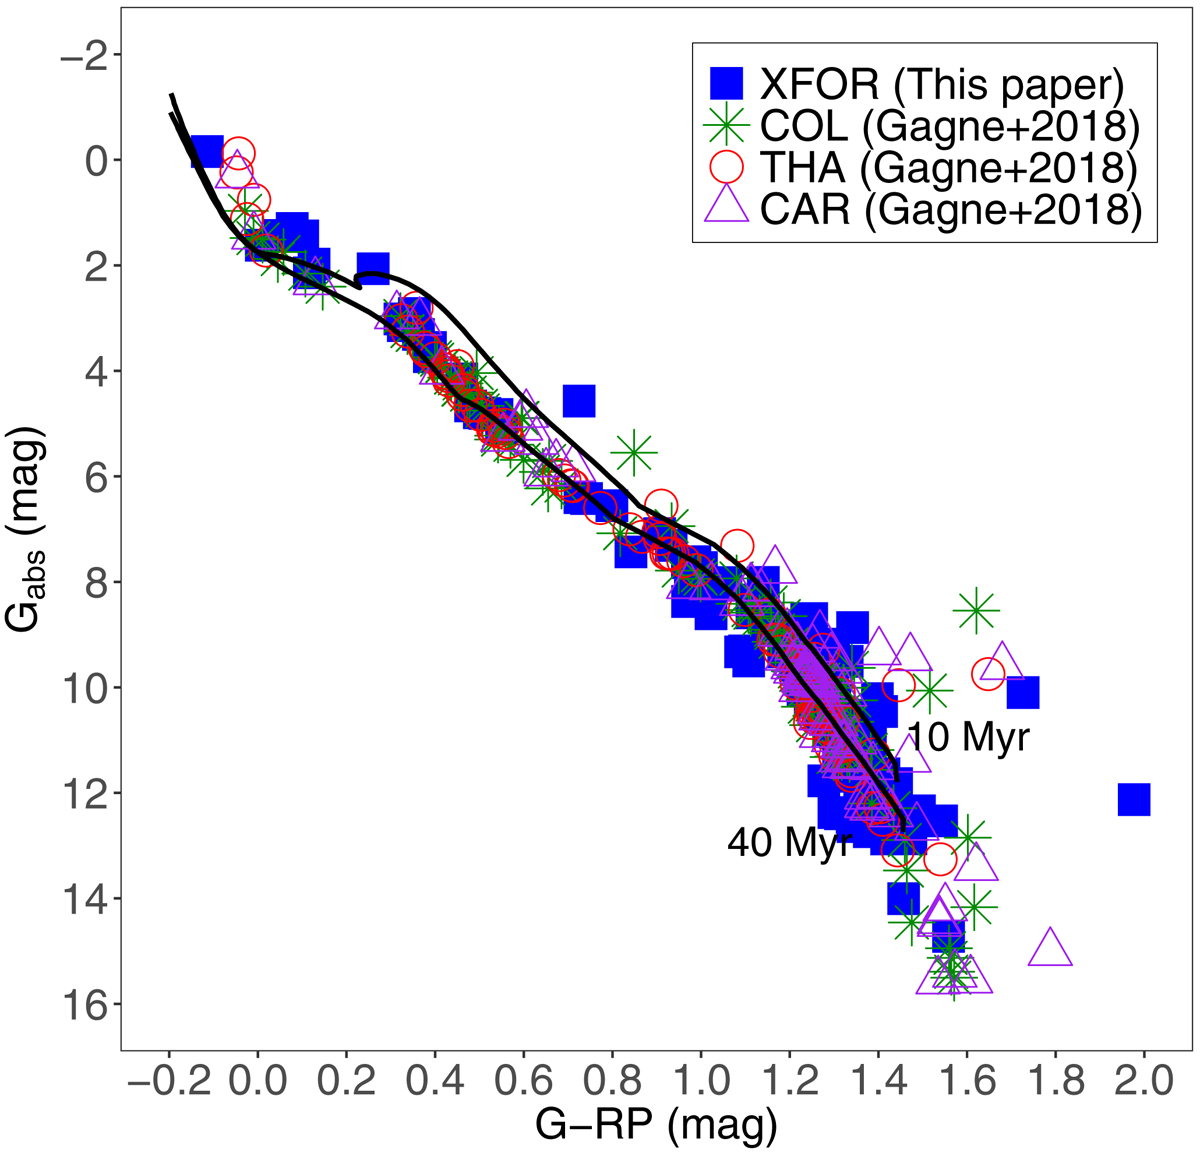
Fig. 8.
Download original image
Absolute colour-magnitude diagram derived from Gaia-EDR3 photometry. The different colours and symbols indicate the XFOR cluster members identified in this study and known members of the COL, THA, and CAR stellar groups published in the literature (Gagné et al. 2018a,b; Gagné & Faherty 2018). The solid lines mark the 10 Myr and 40 Myr isochrones from the PARSEC models.
Current usage metrics show cumulative count of Article Views (full-text article views including HTML views, PDF and ePub downloads, according to the available data) and Abstracts Views on Vision4Press platform.
Data correspond to usage on the plateform after 2015. The current usage metrics is available 48-96 hours after online publication and is updated daily on week days.
Initial download of the metrics may take a while.