Fig. 7.
Download original image
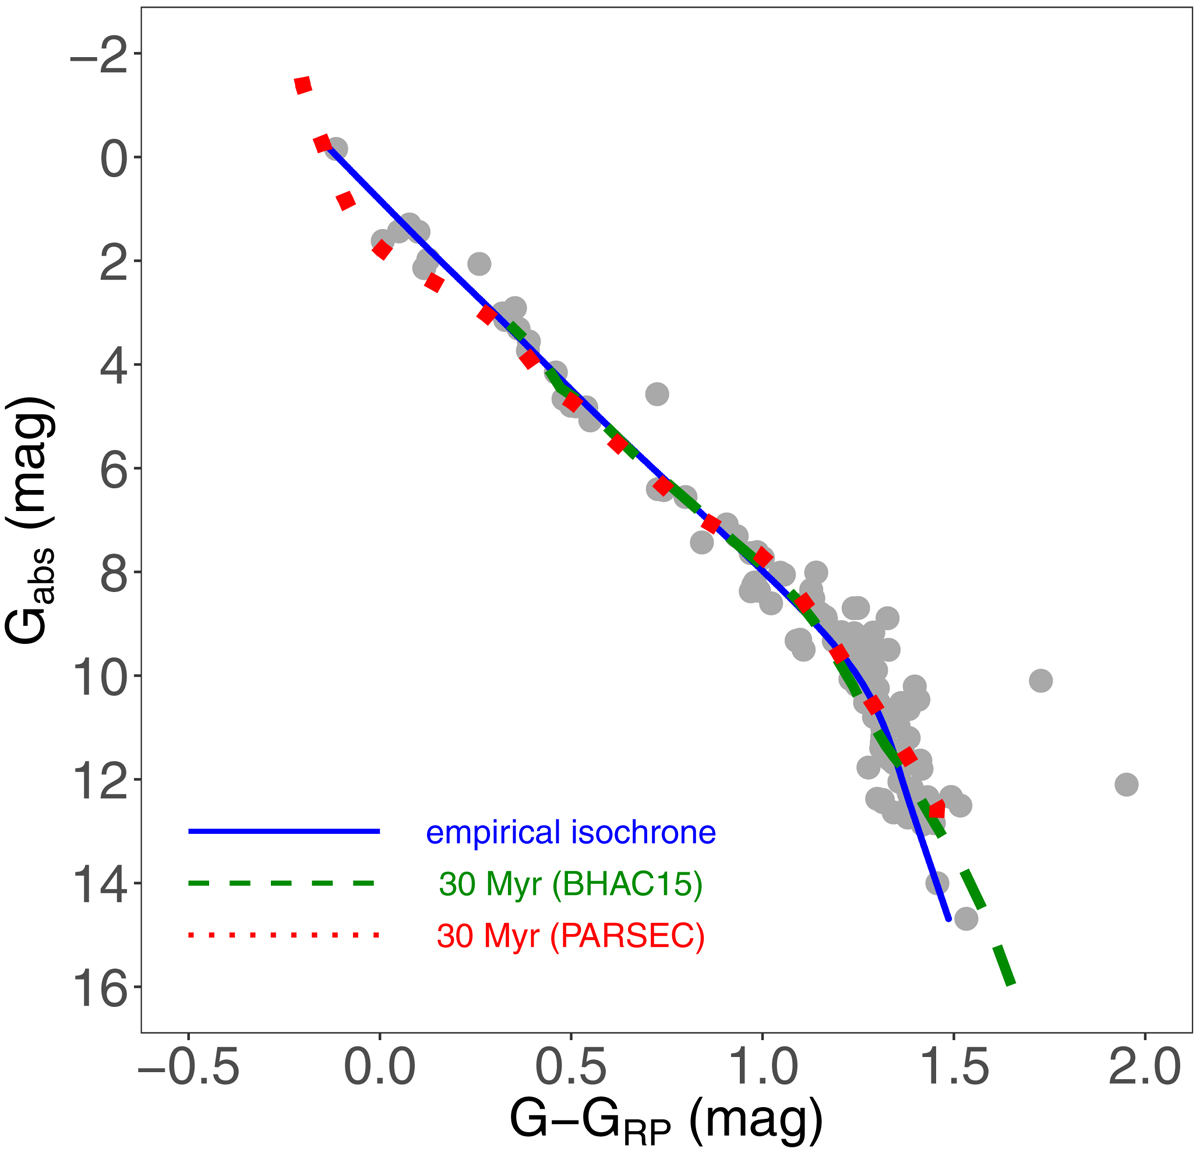
Absolute colour-magnitude diagram of the cluster members identified in our membership analysis (see Sect. 2). The lines indicate the empirical isochrone of the cluster and the 30 Myr isochrones computed from the BHAC15 and PARSEC models. The three stars located above the cluster sequence are Gaia EDR3 5056560315790459776 (033121–303059), Gaia EDR3 4854540344270707200 (032513–370909), and Gaia EDR3 4854879573671981056 (032215–354719).
Current usage metrics show cumulative count of Article Views (full-text article views including HTML views, PDF and ePub downloads, according to the available data) and Abstracts Views on Vision4Press platform.
Data correspond to usage on the plateform after 2015. The current usage metrics is available 48-96 hours after online publication and is updated daily on week days.
Initial download of the metrics may take a while.