Fig. 2.
Download original image
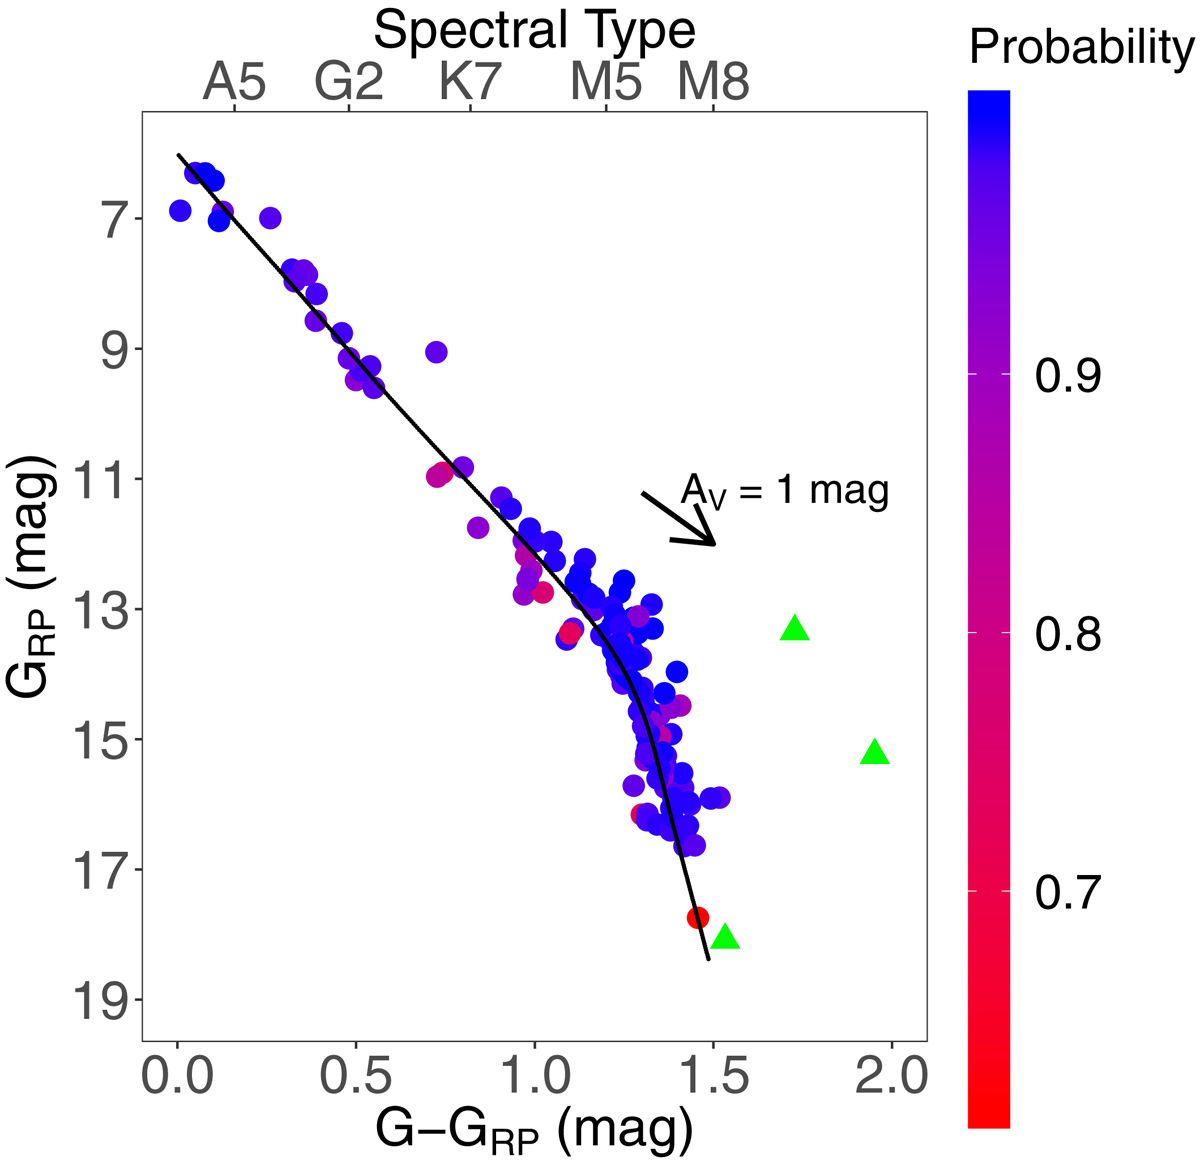
Colour-magnitude diagram of the cluster members selected in our membership analysis. The stars are colour-coded based on their membership probability that is scaled from zero to one. The black solid line shows the empirical isochrone of the cluster (see Table A.3). The arrow indicates the extinction vector of AV = 1 mag converted to the Gaia bands using the relative extinction values given by Wang & Chen (2019). The three sources marked with green triangles denote the components of binary systems that we added manually to the sample, as explained in the text of Sect. 2.
Current usage metrics show cumulative count of Article Views (full-text article views including HTML views, PDF and ePub downloads, according to the available data) and Abstracts Views on Vision4Press platform.
Data correspond to usage on the plateform after 2015. The current usage metrics is available 48-96 hours after online publication and is updated daily on week days.
Initial download of the metrics may take a while.