Open Access
Fig. 10.
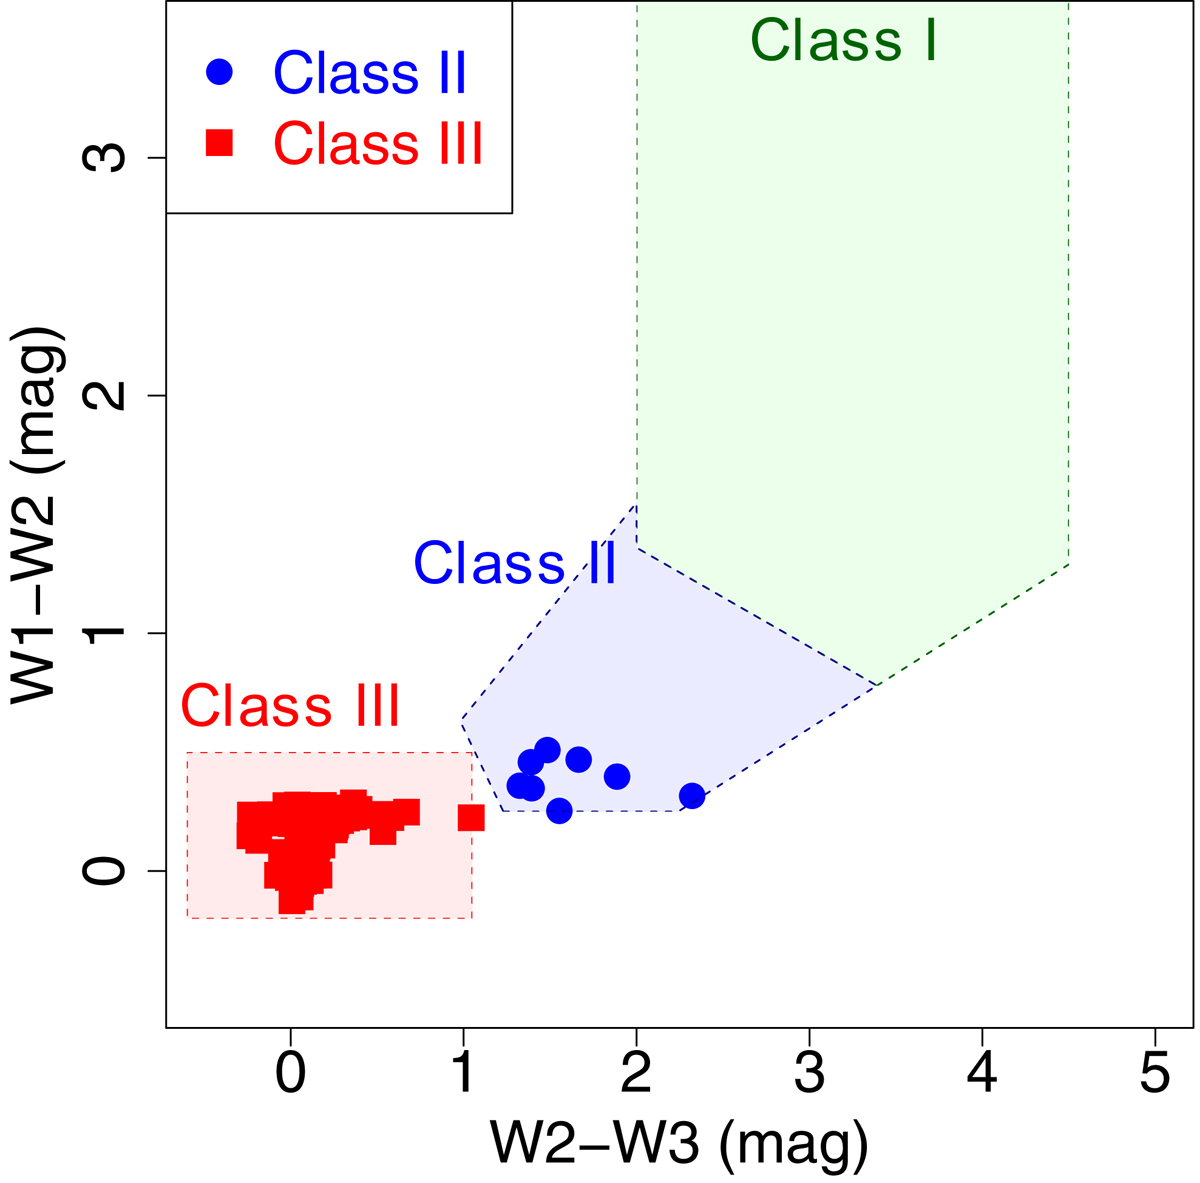
Download original image
Colour-colour diagram of cluster members using infrared photometry from the AllWISE catalogue. This is one of the diagrams used in the classification scheme developed by Koenig & Leisawitz (2014) to distinguish the SED subclasses based on infrared excess emission.
Current usage metrics show cumulative count of Article Views (full-text article views including HTML views, PDF and ePub downloads, according to the available data) and Abstracts Views on Vision4Press platform.
Data correspond to usage on the plateform after 2015. The current usage metrics is available 48-96 hours after online publication and is updated daily on week days.
Initial download of the metrics may take a while.