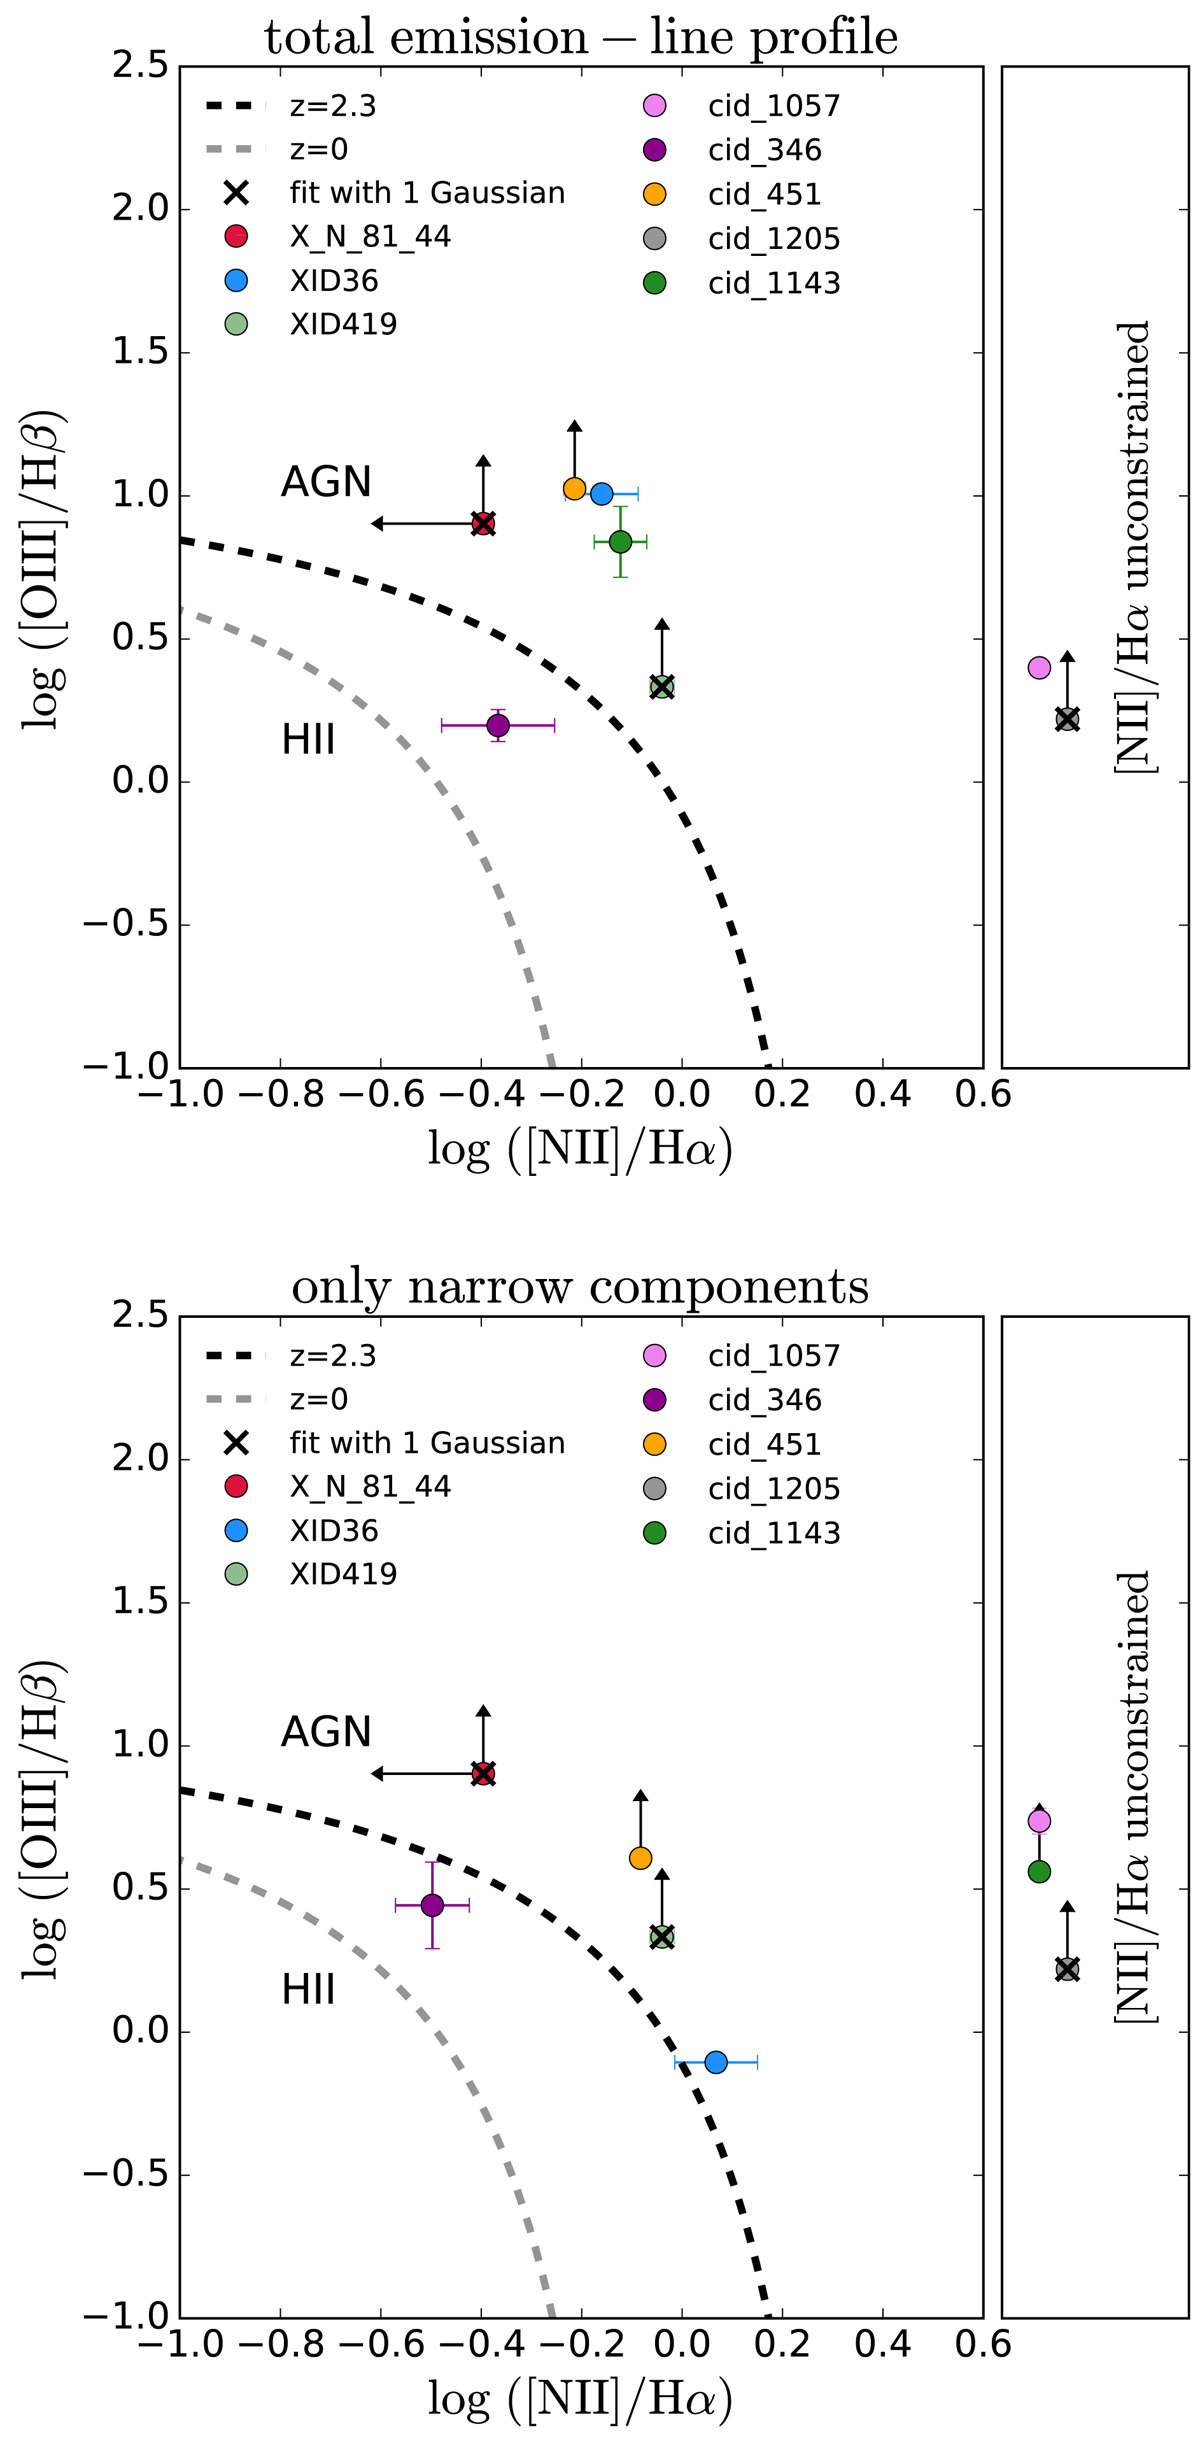
Fig. 7.
Download original image
Emission lines diagnostic diagrams. The curves show the separation between star-forming galaxies and AGN at redshift z = 0 (grey) and z = 2.3 (black) from Kewley et al. (2013a). In the cases where one line is not detected (S/N < 3), the line ratio is shown with an arrow indicating a 5σ upper (or lower) limit. In the cases where both the Hα and [N II] lines are not detected, the [N II]/Hα line ratio is unconstrained (see box on the right). Upper panel: the line ratios are measured from the total emission line profile. Lower panel: the line ratios are calculated using the fluxes of only the narrow Gaussian component. For the three targets for which the emission lines were fitted with only one Gaussian component (marked with black crosses), the line ratios are the same as in the upper panel.
Current usage metrics show cumulative count of Article Views (full-text article views including HTML views, PDF and ePub downloads, according to the available data) and Abstracts Views on Vision4Press platform.
Data correspond to usage on the plateform after 2015. The current usage metrics is available 48-96 hours after online publication and is updated daily on week days.
Initial download of the metrics may take a while.