Fig. 5.
Download original image
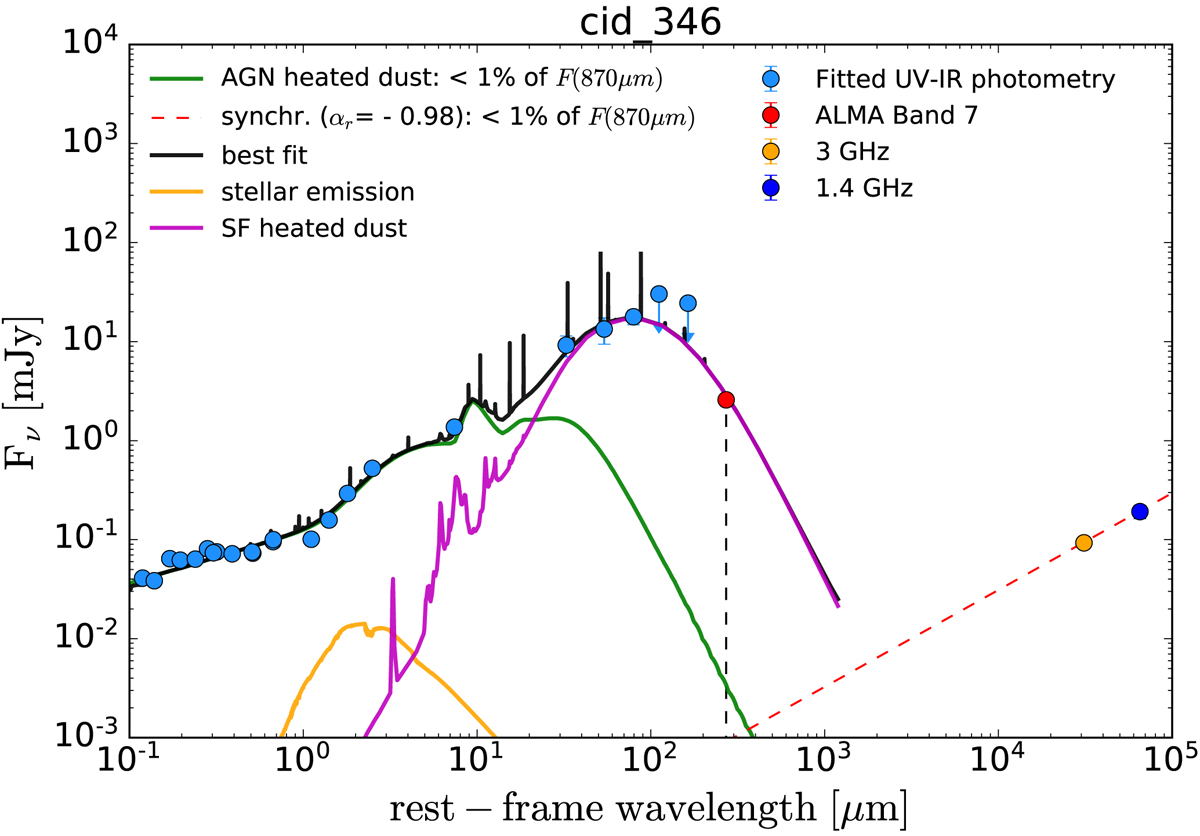
Example rest-frame spectral energy distribution (SED) of one of our targets (cid_346). The light blue data points represent the UV-IR photometry used for the SED fit. The arrows indicate 3σ upper limits. The red point shows our ALMA Band 7 flux measurement (included in the fit). The blue and orange points show the radio fluxes at 1.4 and 3 GHz, respectively. The solid curves show the different components of the SED modelling performed with CIGALE. To estimate the maximum contribution of synchrotron emission to the rest-frame 260 μm flux density, we parametrised this emission as a power law with spectral index αr = −1.25 (dashed red line), derived based on the 1.4 and 5.5 GHz data. The estimated contributions to the 260 μm flux from dust heated by the AGN and from synchrotron emission are also shown.
Current usage metrics show cumulative count of Article Views (full-text article views including HTML views, PDF and ePub downloads, according to the available data) and Abstracts Views on Vision4Press platform.
Data correspond to usage on the plateform after 2015. The current usage metrics is available 48-96 hours after online publication and is updated daily on week days.
Initial download of the metrics may take a while.