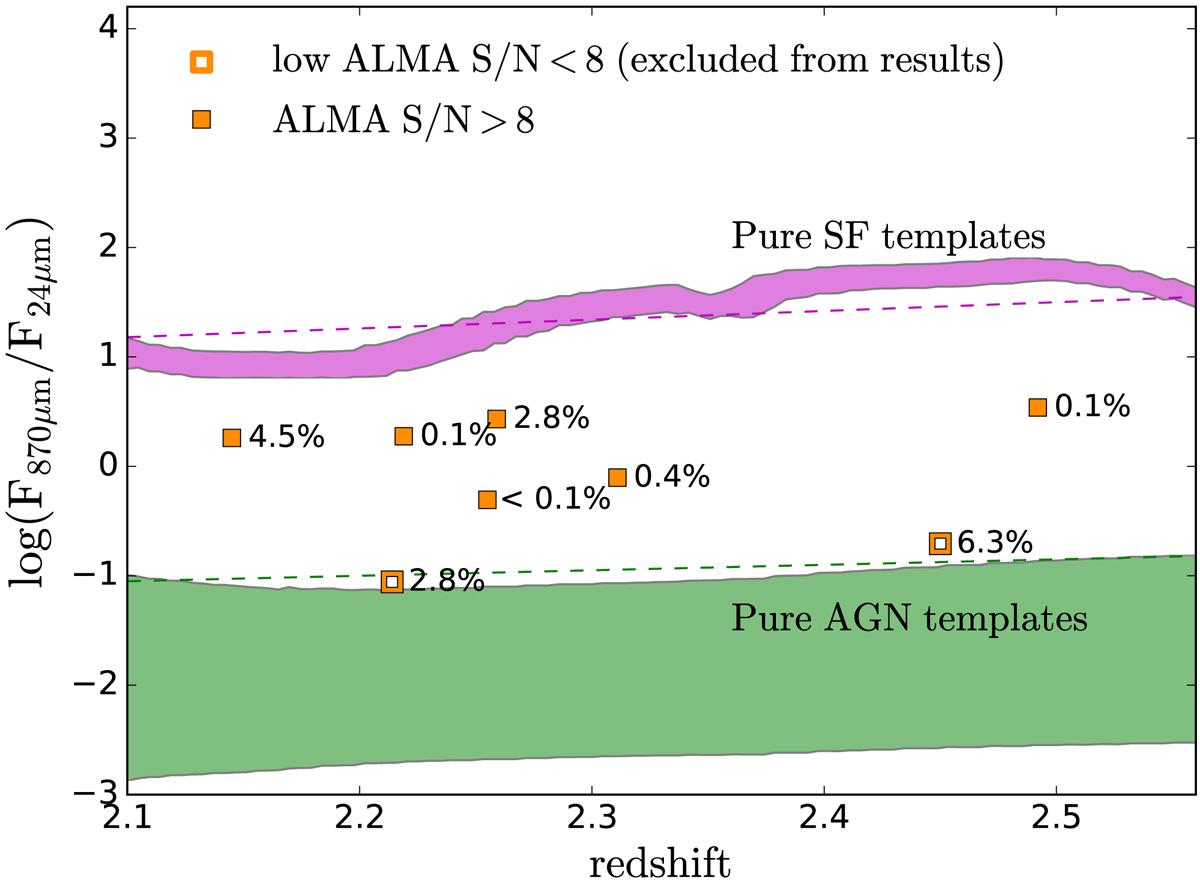
Fig. 4.
Download original image
Ratio of (observed-frame) 870 μm to 24 μm flux as a function of redshift for our targets calculated using the measured F(870 μm) from the ALMA maps. The two sources with peak S/N < 8 in the ALMA maps are marked with empty symbols (cid_1057 and cid_451). The numbers show the percentage AGN contribution at 870 μm (observed-frame) estimated from the modelled SEDs (see Sect. 5.1). The dashed lines show the median flux ratio as a function of redshift for star-forming (SF) galaxies templates (magenta) and AGN templates (green) from Stanley et al. (2018). The shaded areas show the range of flux ratios obtained from the SF (magenta) and AGN (green) templates used to fit our ALMA targets.
Current usage metrics show cumulative count of Article Views (full-text article views including HTML views, PDF and ePub downloads, according to the available data) and Abstracts Views on Vision4Press platform.
Data correspond to usage on the plateform after 2015. The current usage metrics is available 48-96 hours after online publication and is updated daily on week days.
Initial download of the metrics may take a while.