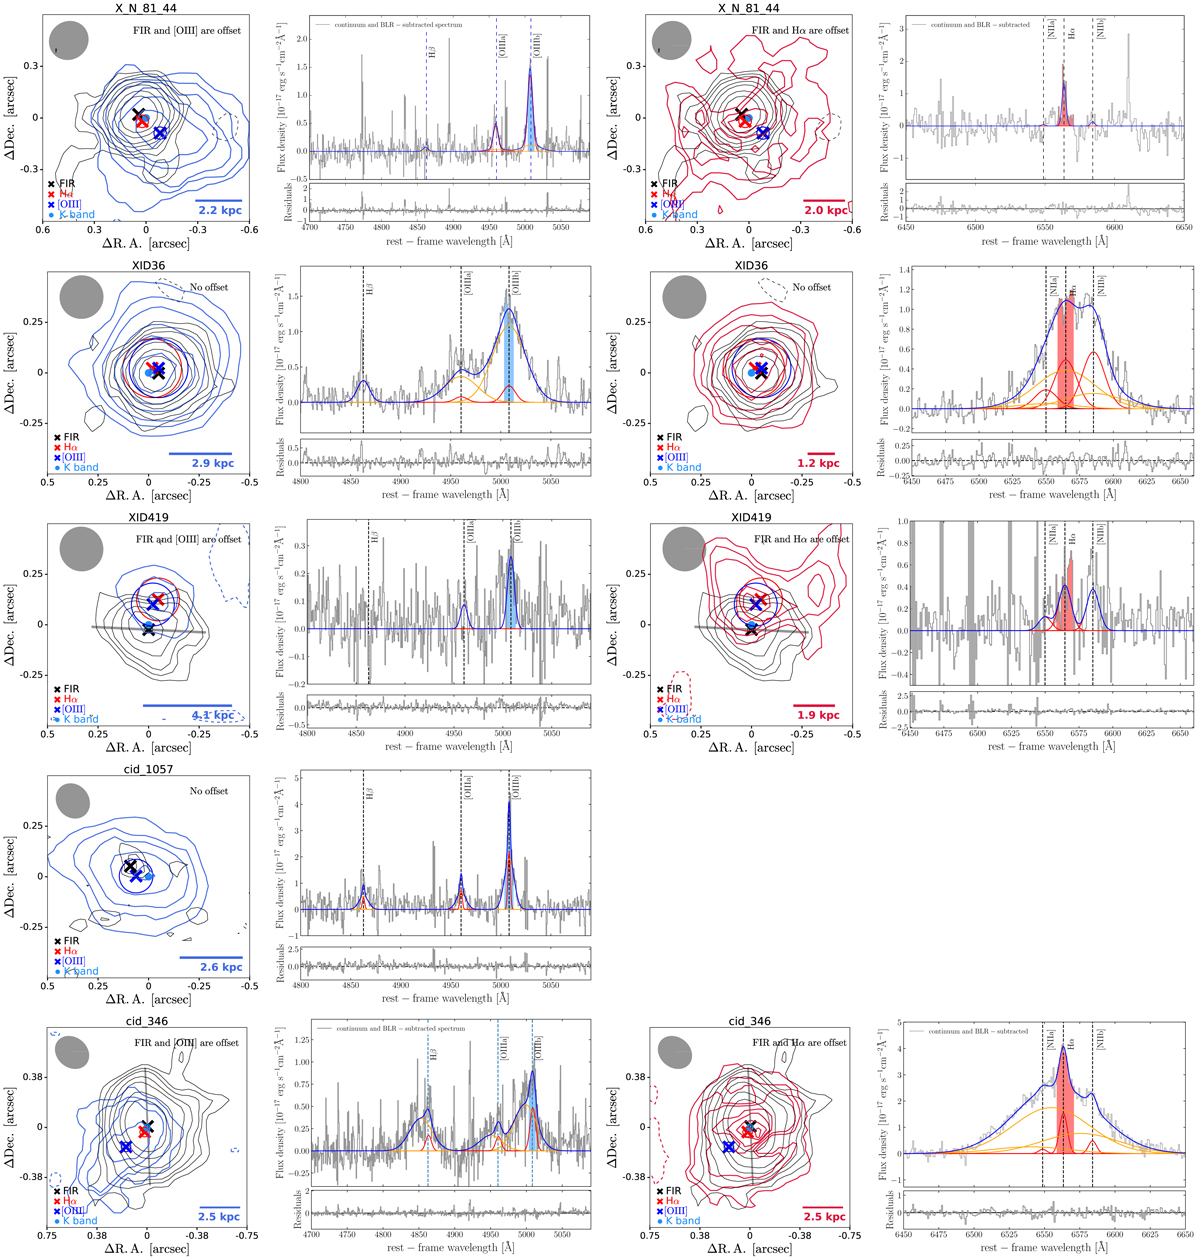
Fig. 3.
Download original image
[O III] and Hα continuum-subtracted maps (where available), with the corresponding spectra. For the Type 1 AGN (X_N_81_44, cid_346 and cid_1205), the broad line region component is also subtracted. The [O III] and Hα maps were created by integrating the spectrum over the [−300, 300] km s−1 velocity range, with respect to the centre of the line (see shaded regions on spectra). The FIR (black), [O III] (lightblue), and Hα (red) emission contours are shown at the 2, 3, 4, 6, 8, 12, and 16σ levels. Dashed lines indicate the negative −2σ contours. The crosses show the position of the centroid of the FIR (black), [O III] (blue) and Hα (red) emission with the respective uncertainties (circles). The lightblue point shows the centroid position of the optical continuum (i.e. K-band observed-frame). In all maps, the grey ellipses show the size of the ALMA beam, while the scale-bars give the size of the PSF of the line emission maps. The grey bar shows the position angle along the major axis of the FIR emission, when it can be reliably determined (see Sect. 3.3.1). Column 1: contours of the [O III] emission (lightblue) and FIR (rest-frame) 260 μm continuum emission (black). Column 2: continuum-subtracted (integrated) [O III]+Hβ spectra. The blue curve shows the total fit to the Hβ, [O III]λ4959 and [O III]λ5007 lines. The red and orange curves show the narrow and broad components. Column 3: contours of the narrow Hα flux map (red) FIR (rest-frame) 260 μm continuum emission (black). Column 4: same as Col. 2, but for the continuum-subtracted (integrated) Hα+[N II] spectra. The blue curve shows the total fit to the Hα, [N II]λ6548 and [N II]λ6584 lines.
Current usage metrics show cumulative count of Article Views (full-text article views including HTML views, PDF and ePub downloads, according to the available data) and Abstracts Views on Vision4Press platform.
Data correspond to usage on the plateform after 2015. The current usage metrics is available 48-96 hours after online publication and is updated daily on week days.
Initial download of the metrics may take a while.