Fig. 2.

Download original image
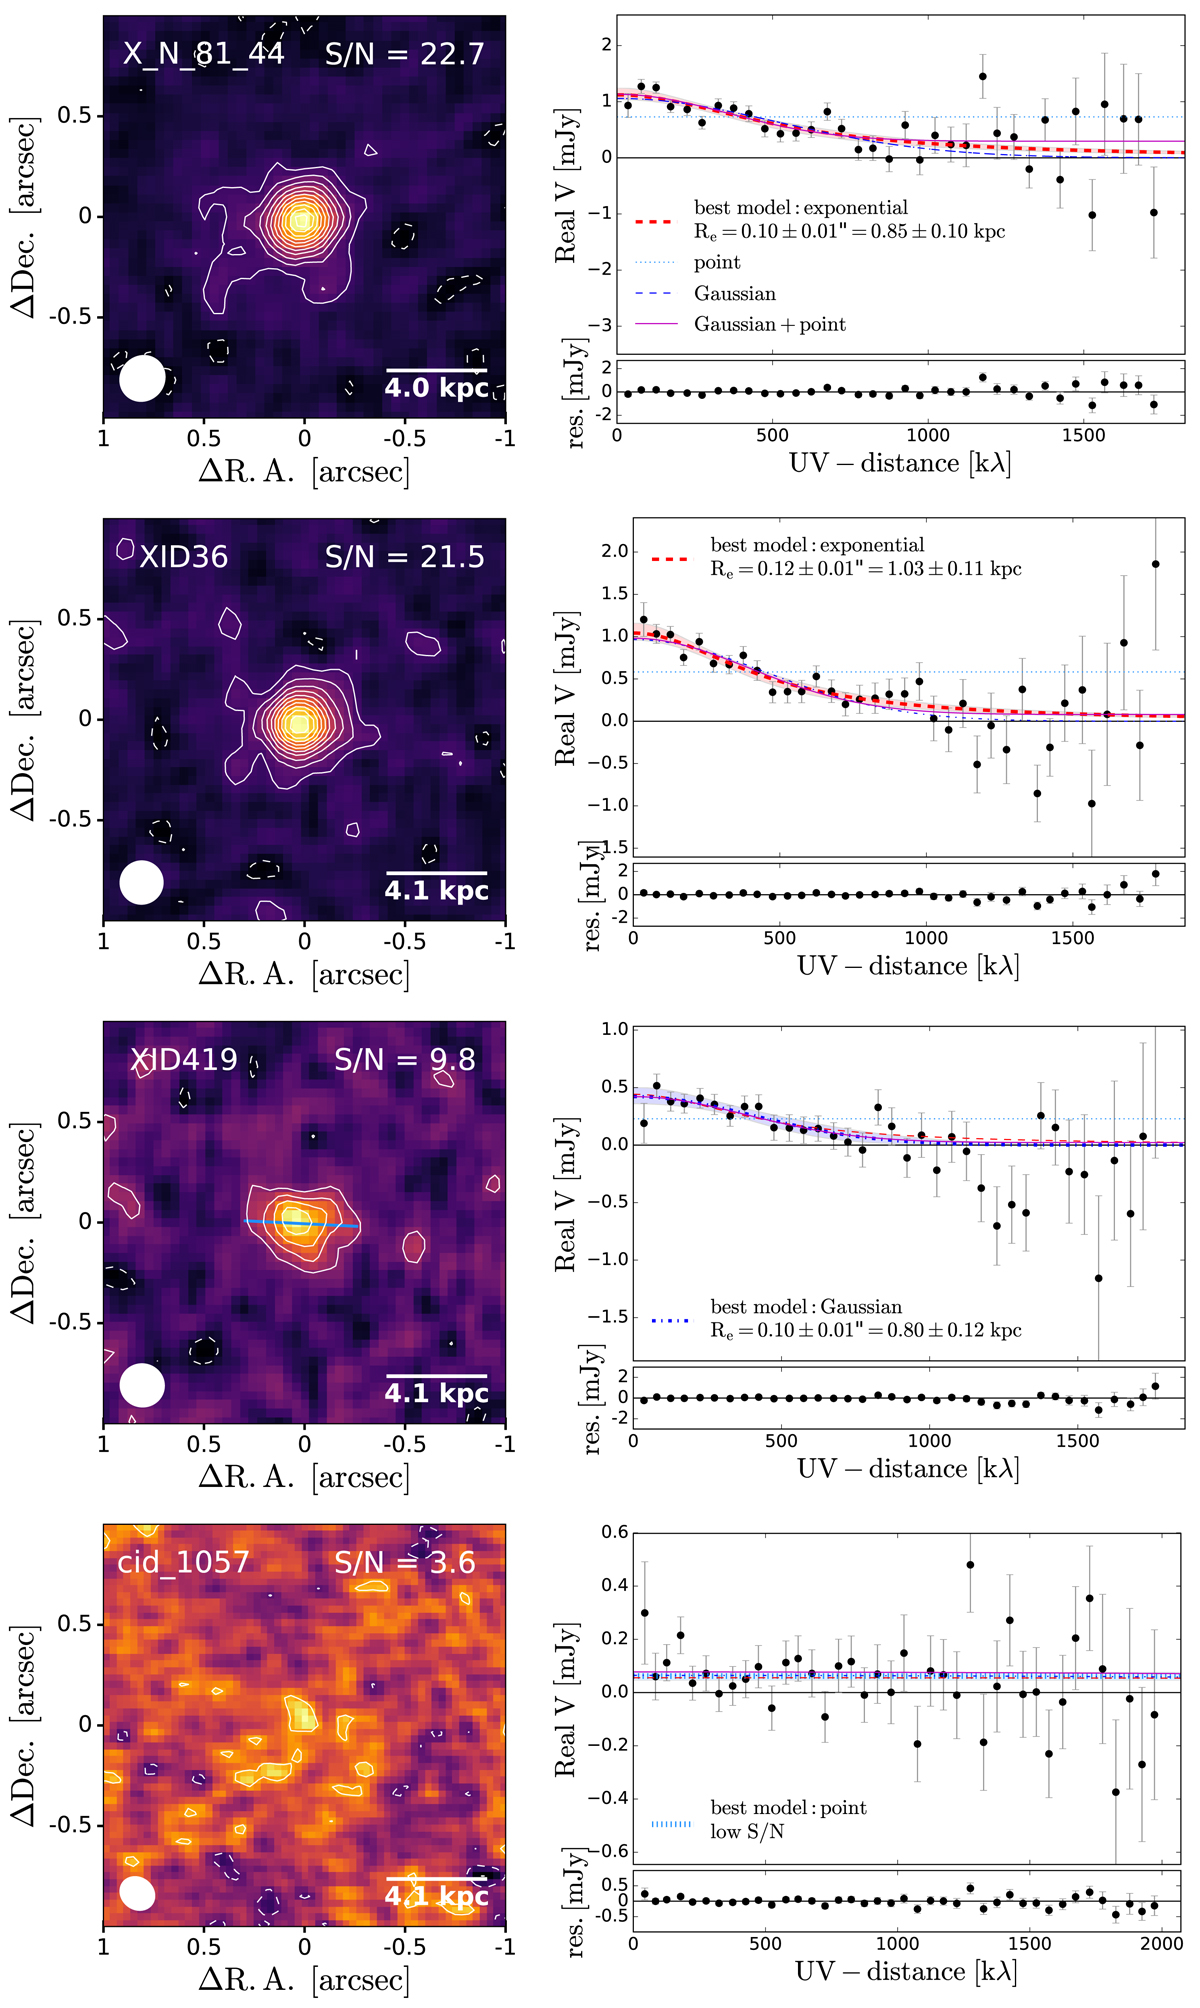
Left column: maps of the ALMA continuum. The white ellipse represents the ALMA beam. The peak S/N is also shown. Contours start at 2σ and increase at intervals of 2σ. Dashed contours are negative contours at −2σ. The lightblue line indicates the position angle along the major axis of the FIR emission, when it can be reliably determined (see Sect. 3.3.1). Right column: real part of the visibilities versus uv-distance. The overlaid straight and curved lines show the fit using different models: point source (dotted lightblue line), exponential (dashed red curve), Gaussian (dashed-dotted blue curve), and Gaussian profile plus point source (solid magenta curve). The best model according the Bayesian Information Criterion (BIC) is labelled in each case. The shaded area shows the 1σ uncertainties on the best fit model. Lower panel: residuals with respect to the best-fit model.
Current usage metrics show cumulative count of Article Views (full-text article views including HTML views, PDF and ePub downloads, according to the available data) and Abstracts Views on Vision4Press platform.
Data correspond to usage on the plateform after 2015. The current usage metrics is available 48-96 hours after online publication and is updated daily on week days.
Initial download of the metrics may take a while.


