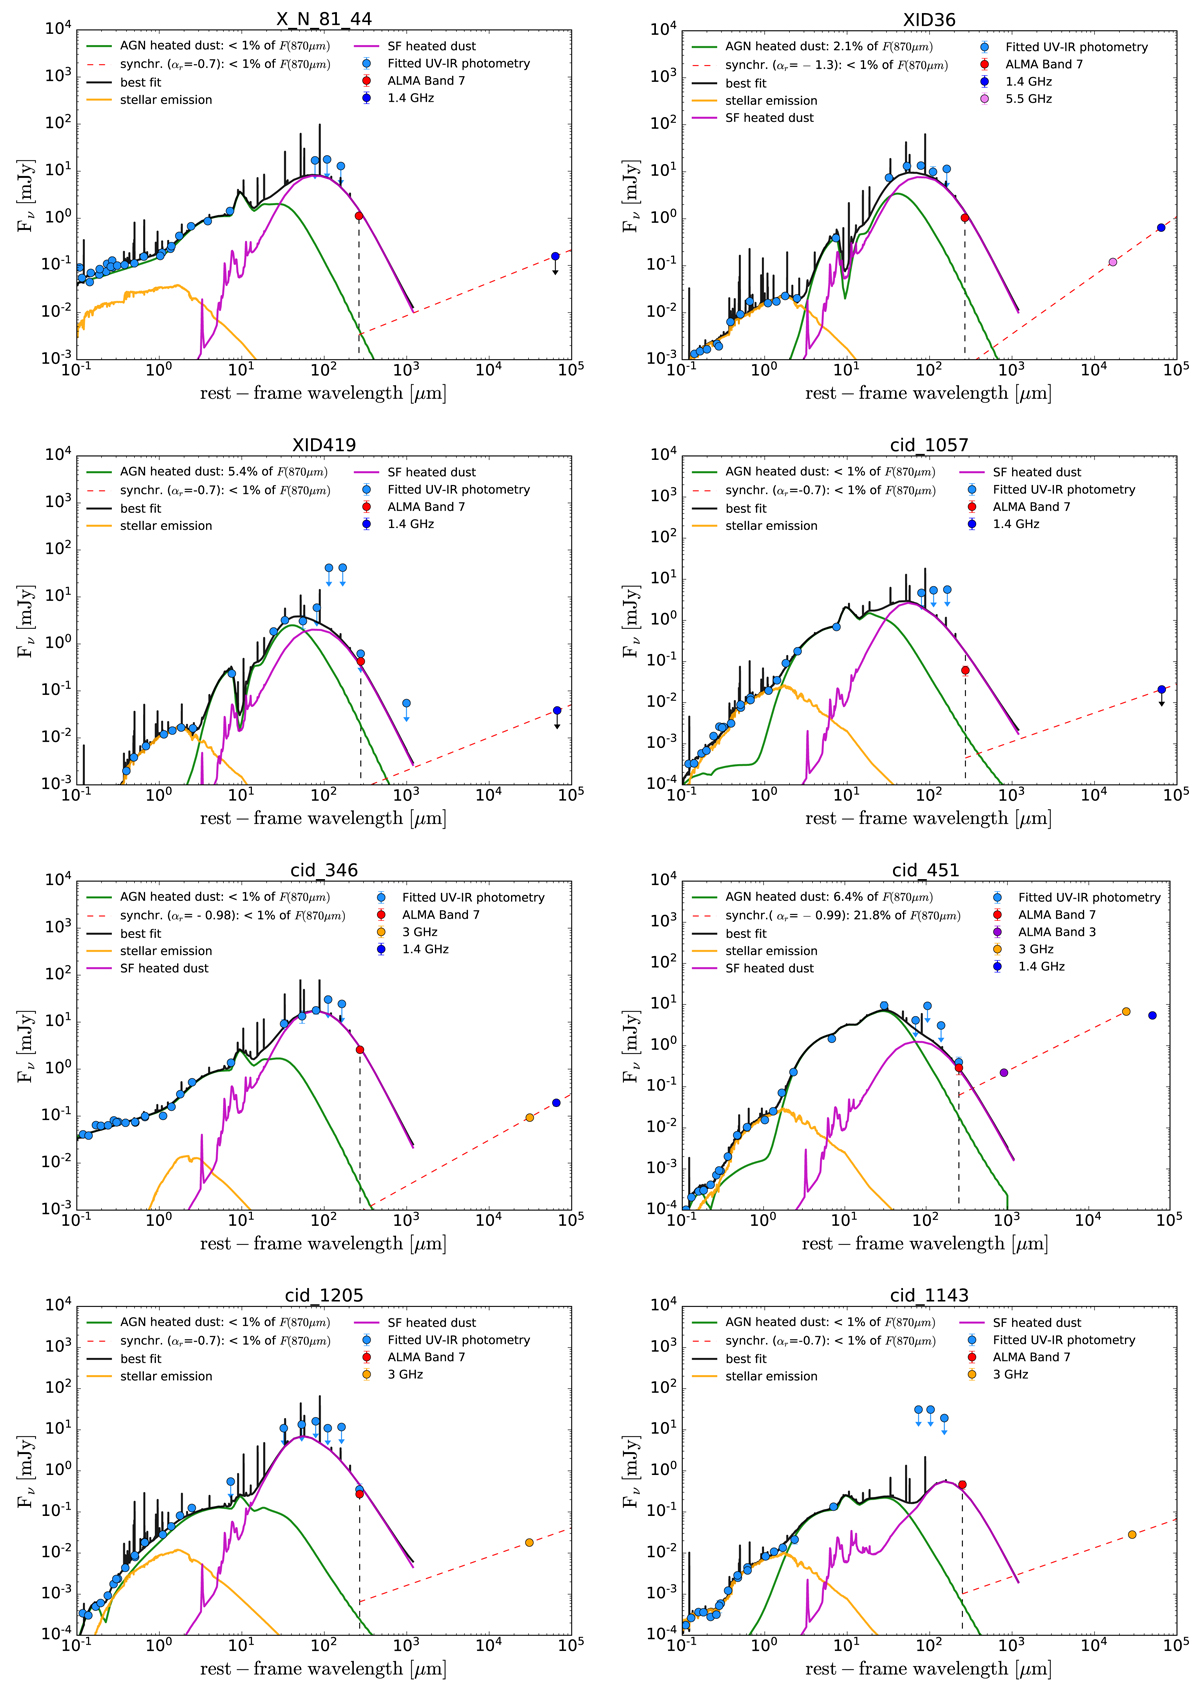
Fig. E.1.
Download original image
Rest-frame spectral energy distribution (SED) of our sample. The light blue data points represent the UV-IR photometry that was used for the SED fitting (Circosta et al. 2018). The red point shows our ALMA Band 7 flux measurements, which was also included in the fit. The violet point in cid_451 shows the ALMA Band 3 flux from Circosta et al. (2021). The blue, orange, and pink points show the radio fluxes at 1.4, 3, and 5 GHz, respectively. The arrows indicate 3σ upper limits. The solid curves show the results of the SED fitting with CIGALE: in black is the total best-fit model (including the contribution the from nebular emission component), in orange the dust-attenuated stellar emission, in magenta the emission from dust heated by star formation and in green the emission from dust heated by the AGN. To estimate the maximum contribution of synchrotron emission to the rest-frame 260 μm flux density we parameterized this emission as a power law with spectral index αr (dashed red line), normalised at 3 GHz (10cm) or 1.4 GHz (21cm), depending on the available radio data. For the galaxies with radio fluxes in two bands, we derived αr based on the two fluxes. On the plot we show the estimated contribution (in percentage) from dust heated by the AGN and from synchrotron emission to the rest-frame 260 μm ALMA Band 7 flux, estimated from the total SED template.
Current usage metrics show cumulative count of Article Views (full-text article views including HTML views, PDF and ePub downloads, according to the available data) and Abstracts Views on Vision4Press platform.
Data correspond to usage on the plateform after 2015. The current usage metrics is available 48-96 hours after online publication and is updated daily on week days.
Initial download of the metrics may take a while.