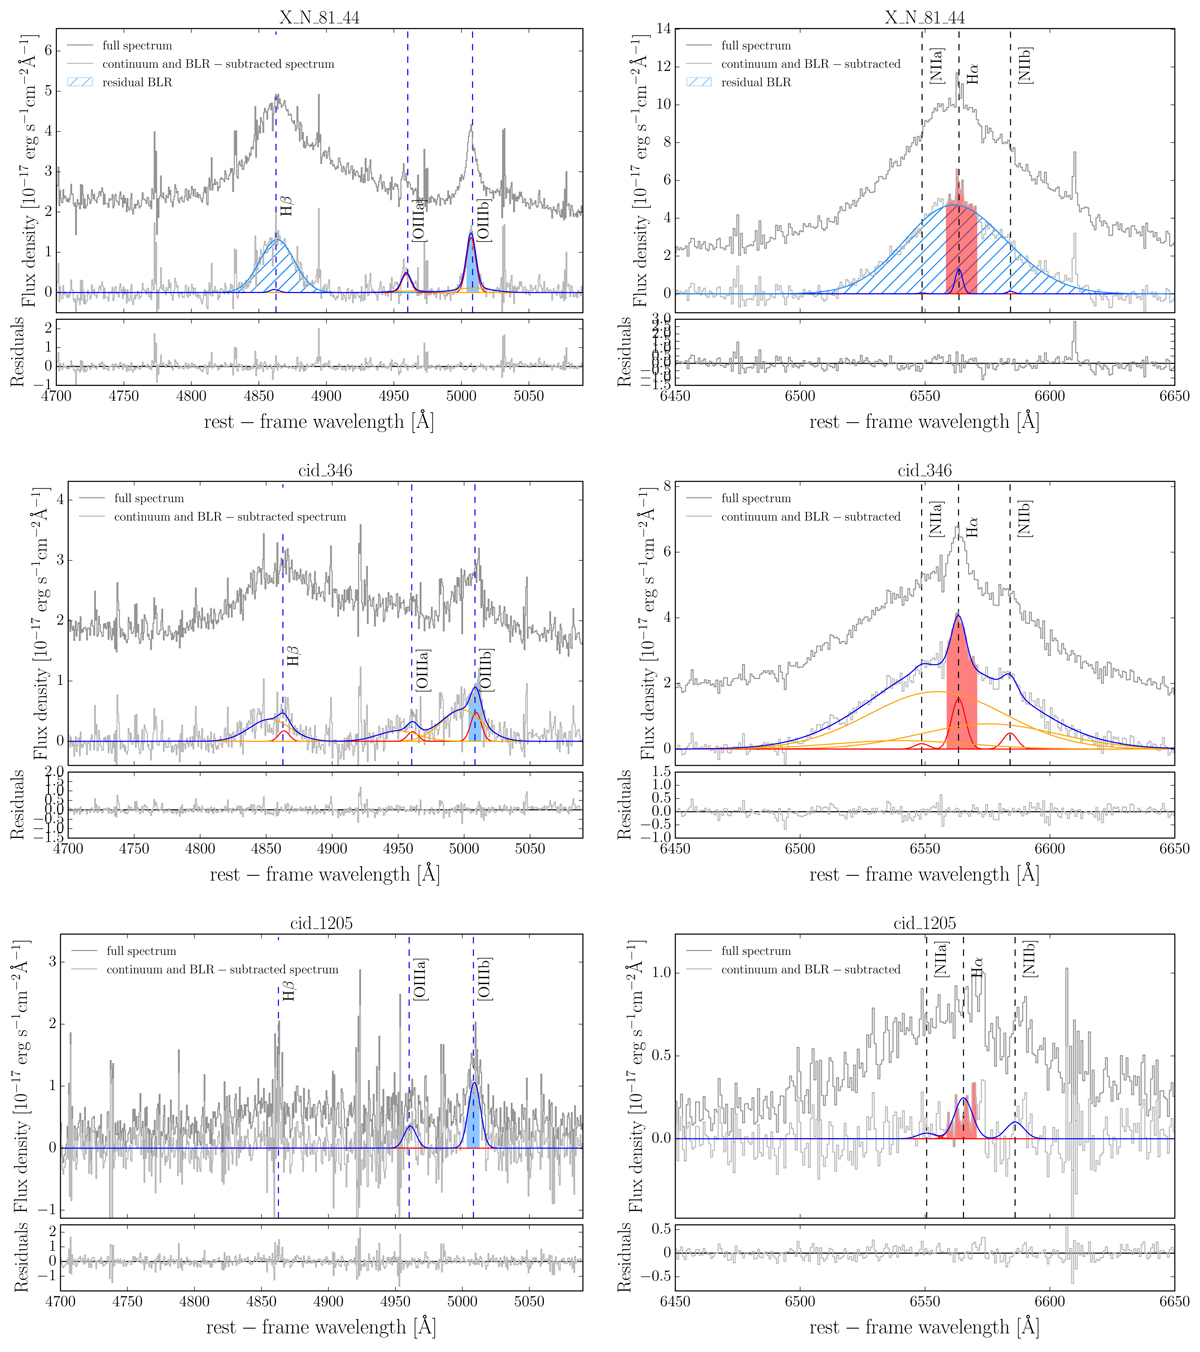
Fig. D.1.
Download original image
Integrated spectra of Type 1 AGN in our sample: [O III]+Hβ spectra (left) and Hα+[N II] spectra (right). The continuum- and BLR-subtracted spectra are shown in light-grey. The total spectra, before subtracting the continuum and broad line region (BLR) emission, are shown in dark grey. The blue curves show the total fit to the Hβ, [O III]λ4959 and [O III]λ5007 lines (left panel) and to the Hα, [N II]λ6548 and [N II]λ6584 lines (right panel). The red and orange curves show the narrow and broad components, respectively. For X_N_81_44, the broad components of the Hβ and Hα are considered as part of the BLR.
Current usage metrics show cumulative count of Article Views (full-text article views including HTML views, PDF and ePub downloads, according to the available data) and Abstracts Views on Vision4Press platform.
Data correspond to usage on the plateform after 2015. The current usage metrics is available 48-96 hours after online publication and is updated daily on week days.
Initial download of the metrics may take a while.