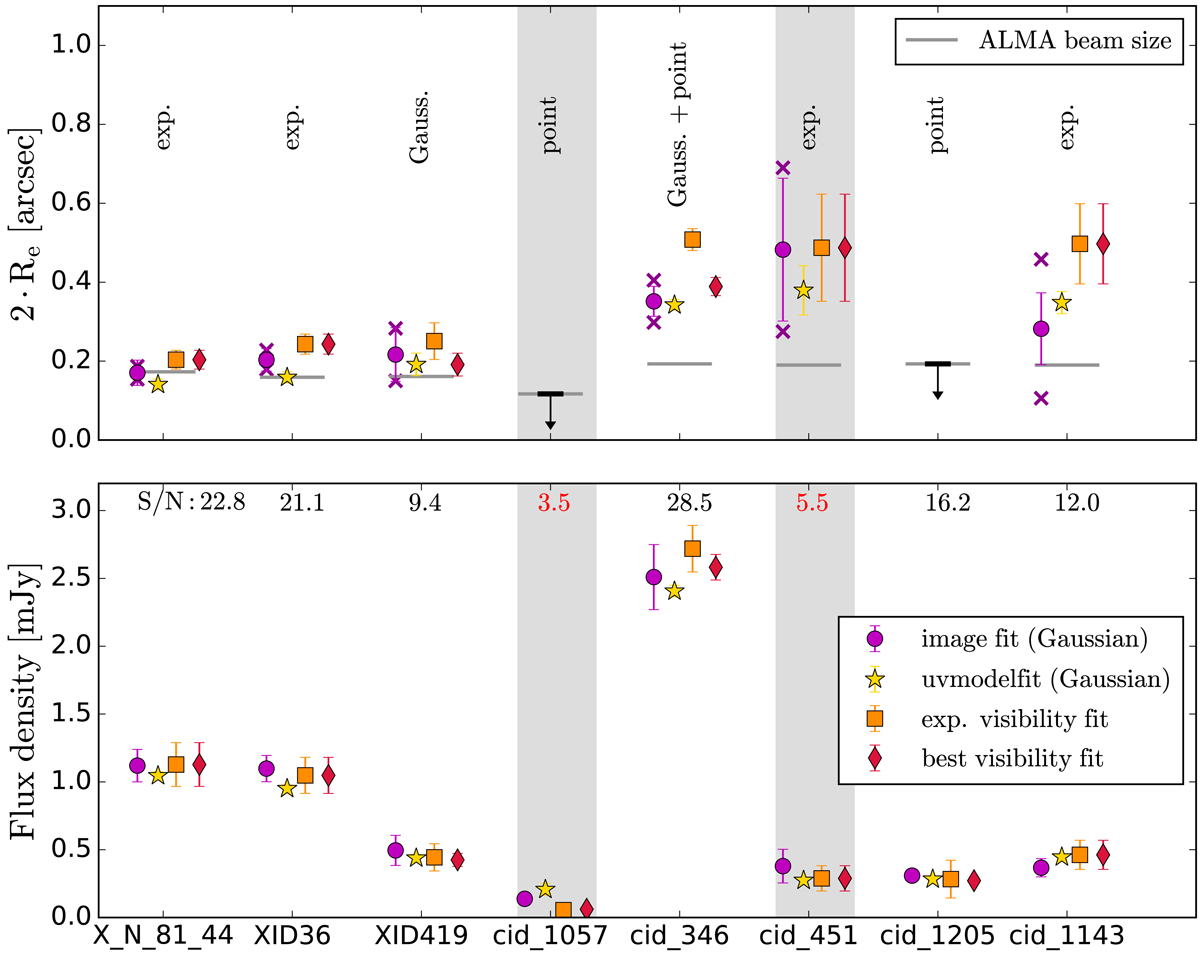
Fig. B.1.
Download original image
Comparison of the FIR sizes and flux densities derived using different methods: fit of a 2D Gaussian on the image plane (circles), fit of a 2D Gaussian using uvmultifit (stars), fit of the visibilities assuming an exponential profile (squares), and fit of the visibilities with the ‘preferred model’ according to the BIC (diamonds). The preferred model for each object is written on the top part of the figure. Upper panel: size measurements expressed as two times the effective radius (Re). The grey horizontal lines represent the size of the ALMA beam for each object. For the 2D Gaussian fit on the image plane, the two magenta crosses represent the sizes of the major and minor axis. For point sources, we show the upper limit corresponding to the beam size. Bottom panel: integrated flux densities measured with different methods. The peak signal-to-noise (S/N) of the ALMA images is written on the top part of the panel. The results for the two objects with S/N too low to obtain reliable measurements (cid_1057 and cid_451) are highlighted with background grey shading.
Current usage metrics show cumulative count of Article Views (full-text article views including HTML views, PDF and ePub downloads, according to the available data) and Abstracts Views on Vision4Press platform.
Data correspond to usage on the plateform after 2015. The current usage metrics is available 48-96 hours after online publication and is updated daily on week days.
Initial download of the metrics may take a while.