Fig. 10.
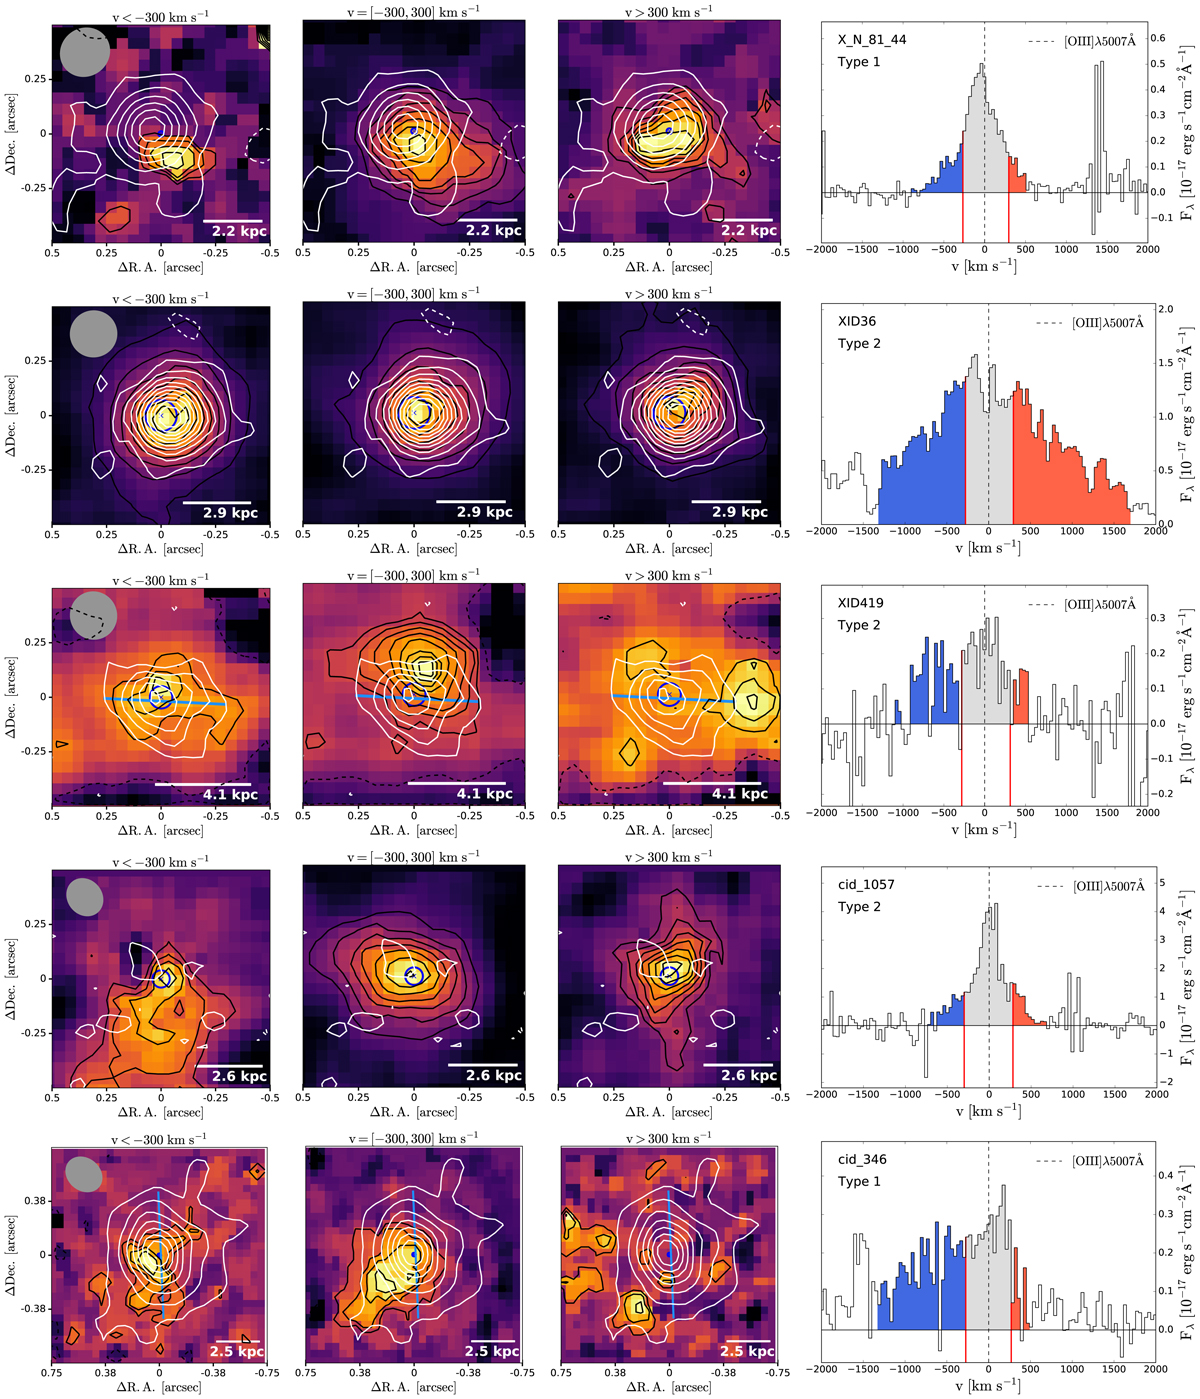
Download original image
Maps of [O III] emission in three different velocity channels: blue-shifted emission (< −300 km s−1, first column), central channel ([−300, 300] km s−1, second column), red-shifted emission (> 300 km s−1, third column). The interval over which the spectrum has been integrated is indicated on the right plot. In black are the [O III] emission contours starting from 2σ and increasing in intervals of 1σ (and in intervals of 2σ for XID36, cid_451 and cid_1143, to improve presentation). In white are the FIR emission contours, starting from 2σ and increasing in intervals of 2σ (or intervals of 4σ for X_N_81_44 and cid_346, to improve presentation). Negative −2σ contours are shown with dashed curves. The grey ellipse shows the size of the ALMA beam, while the white scale-bar shows the size of the PSF of the [O III] image in kpc. The blue cross and circle show the position and uncertainty of the optical continuum. The lightblue bar indicates the position angle along the major axis of the FIR emission, when it can be reliably determined (see Sect. 3.3.1). Fourth column: spectrum around the [O III]λ5007 emission line. The coloured areas show the spectral regions over which the emission was integrated to create the three images on the left.
Current usage metrics show cumulative count of Article Views (full-text article views including HTML views, PDF and ePub downloads, according to the available data) and Abstracts Views on Vision4Press platform.
Data correspond to usage on the plateform after 2015. The current usage metrics is available 48-96 hours after online publication and is updated daily on week days.
Initial download of the metrics may take a while.