Fig. 9.
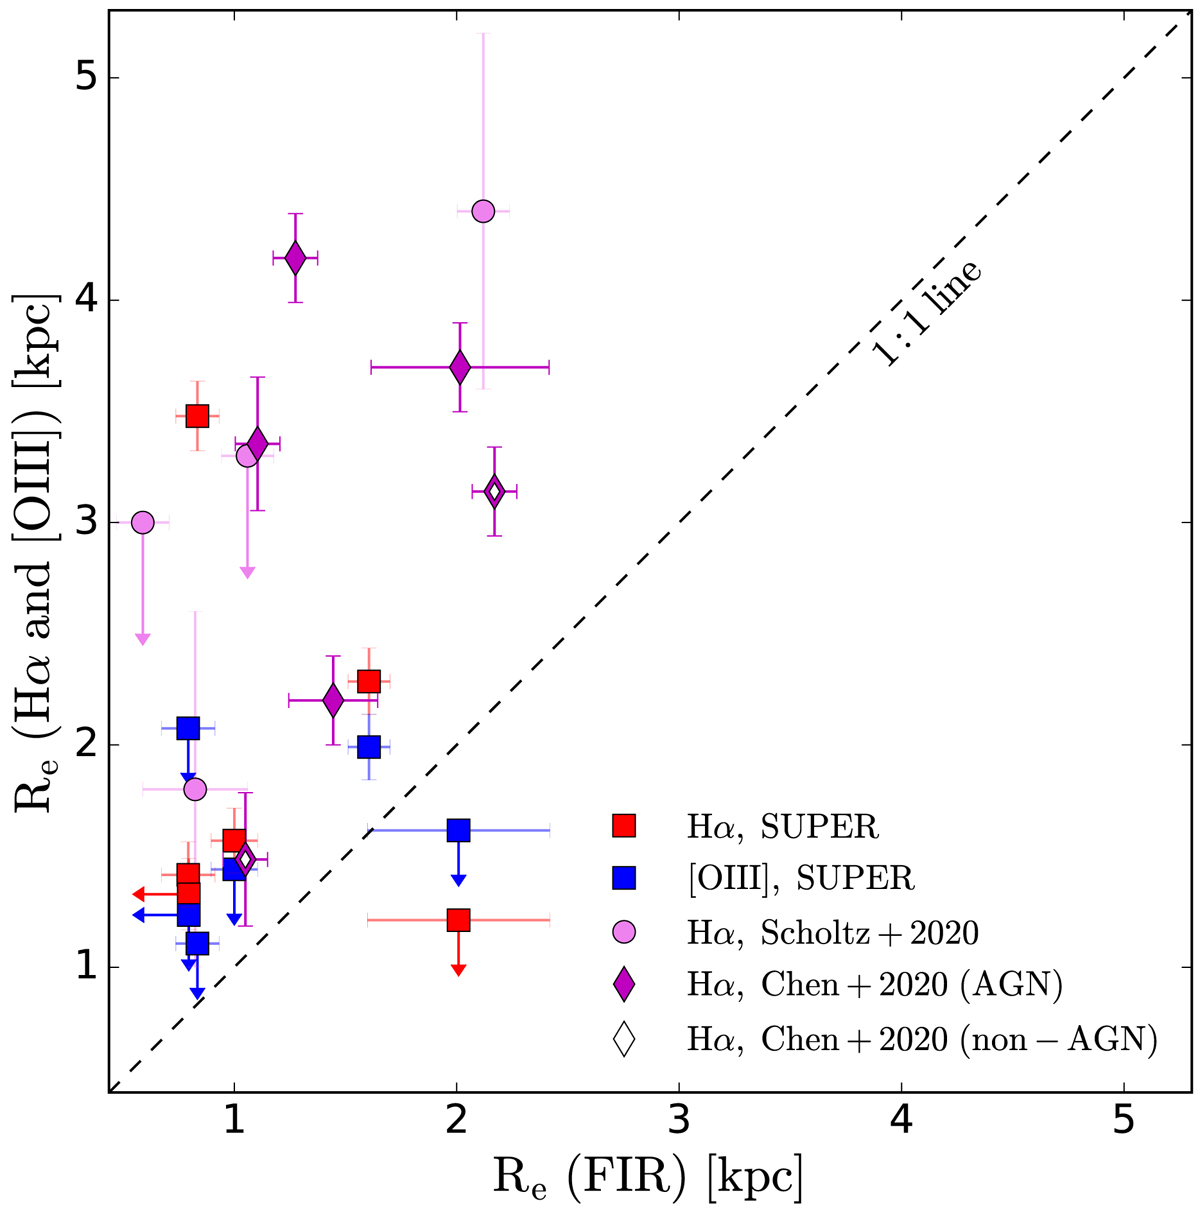
Download original image
Comparison of the size of the FIR emission with the sizes of the Hα (red) and [O III] (blue) emission. The effective radii of the FIR emission are measured from the best fit on the visibilities. The Hα and [O III] sizes are measured by fitting a 2D Gaussian to the images. If the measured size is smaller than the beam, we show the point as an upper limit. The two objects with low S/N (< 8) in the ALMA data are not shown (cid_1057 and cid_451). The FIR and Hα sizes of the sample of z ∼ 2 AGN from Scholtz et al. (2020) and from Chen et al. (2020) are shown with violet circles and magenta diamonds, respectively. The white diamonds are non-AGN from Chen et al. (2020). On average, the FIR sizes are smaller than the Hα and [O III] sizes by a factor of ∼2.
Current usage metrics show cumulative count of Article Views (full-text article views including HTML views, PDF and ePub downloads, according to the available data) and Abstracts Views on Vision4Press platform.
Data correspond to usage on the plateform after 2015. The current usage metrics is available 48-96 hours after online publication and is updated daily on week days.
Initial download of the metrics may take a while.