Fig. 8.
Download original image
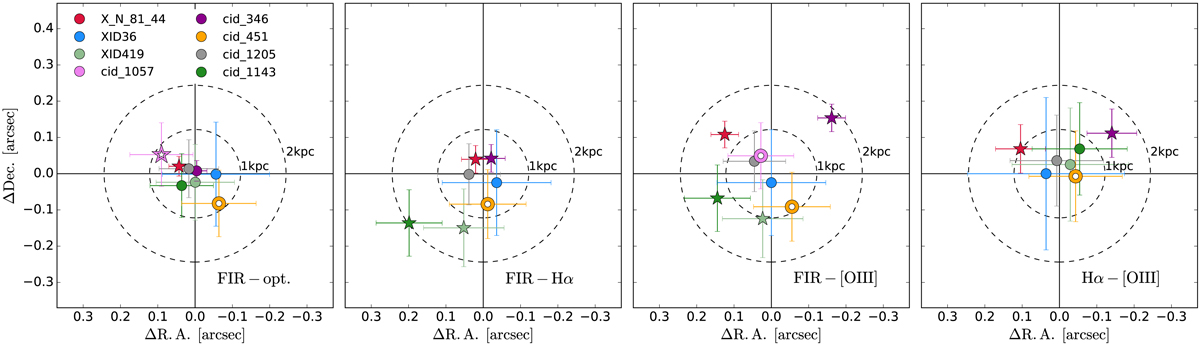
Comparison of the centroid positions of the 2D Gaussian fit to the images of (from left to right): FIR and optical continuum, FIR and Hα emission, FIR and [O III] emission, and Hα and [O III] emission. The coordinates are derived from the centroid of a 2D Gaussian fit to the images. The Hα and [O III] images were created by integrating the spectra over the [−300, 300] km s−1 velocity range. The uncertainties on the position combine the uncertainties on the coordinate registration, on the Gaussian fit and the pixel size. The objects with a significant offset (i.e. difference in RA or Dec larger than the 1σ uncertainty) are shown as star symbols in each plot, while the ones with no significant offset are shown as circles. The dashed circles show the offset corresponding to 1 kpc and 2 kpc at the median redshift of the sample. The two objects with ALMA low S/N < 8 are shown as empty symbols (cid_1057 and cid_451). The position of the Hα and [O III] centroids are in fairly good agreement, while the FIR centroids show larger offset to the centroid positions of the ionised gas (both Hα and [O III]).
Current usage metrics show cumulative count of Article Views (full-text article views including HTML views, PDF and ePub downloads, according to the available data) and Abstracts Views on Vision4Press platform.
Data correspond to usage on the plateform after 2015. The current usage metrics is available 48-96 hours after online publication and is updated daily on week days.
Initial download of the metrics may take a while.