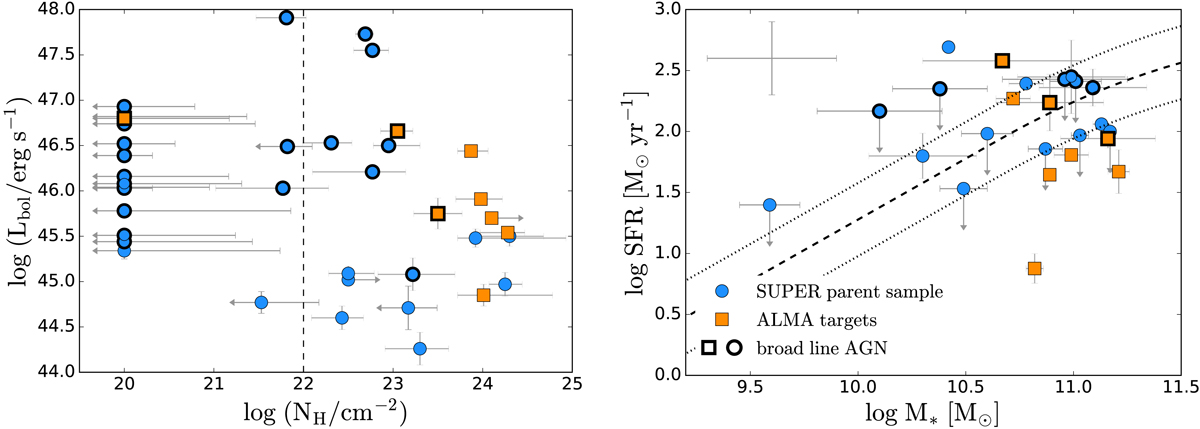
Fig. 1.
Download original image
Left: AGN bolometric luminosity versus hydrogen column density (NH) for the SUPER sample. ALMA targets from this work are marked with orange squares. Targets classified as broad line AGN in the optical are marked with black contours. The dashed line at log(NH/cm−2) = 22 marks the separation between X-ray unobscured and obscured AGN. Right: SUPER sample in the star formation rate (SFR) vs. stellar mass (M*) plane. Only the 24/39 objects with SFR and stellar mass constraints are shown. The size of the systematic uncertainties is shown on the top left corner. The black dashed curve shows the main sequence (MS) of star-forming galaxies from Schreiber et al. (2015) at the average redshift of our target sample (z ∼ 2.3), the 0.3 dex dispersion is showed by dotted lines. Most of the ALMA targets are consistent with being on the MS, with the exception of cid_1143, which lies below.
Current usage metrics show cumulative count of Article Views (full-text article views including HTML views, PDF and ePub downloads, according to the available data) and Abstracts Views on Vision4Press platform.
Data correspond to usage on the plateform after 2015. The current usage metrics is available 48-96 hours after online publication and is updated daily on week days.
Initial download of the metrics may take a while.