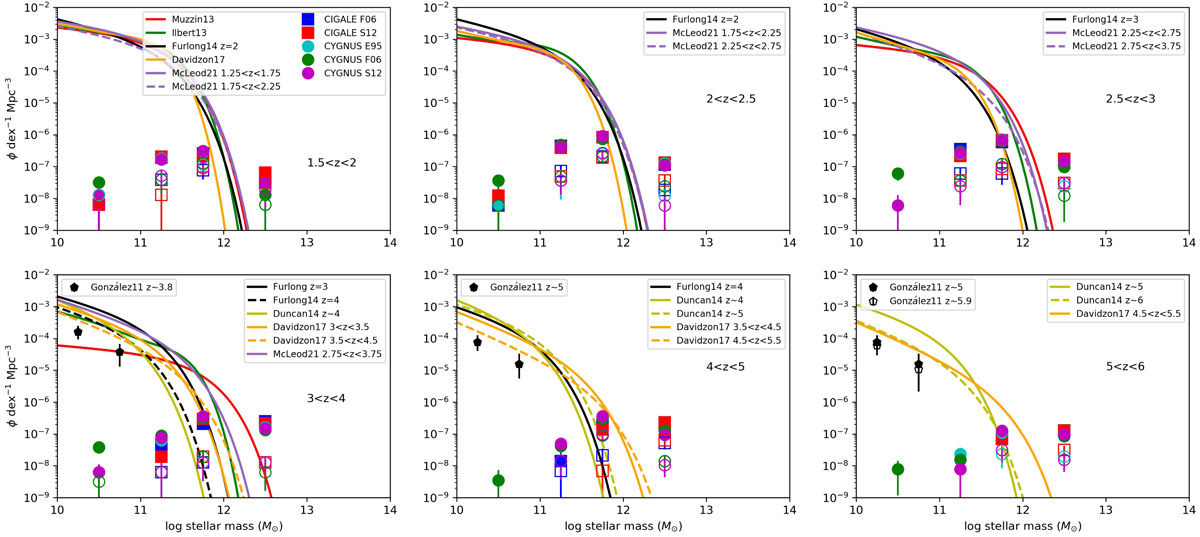
Fig. 7.
Download original image
Co-moving volume density of our HLIRGs in different redshift ranges compared with global stellar mass function measurements from the literature based on observations (red, green, yellow, orange, and purple lines as well as black pentagons) or simulations (black solid line). Error bars combine the Poisson error and the standard deviation among the three deep fields. Empty markers represent a subsample with good quality in the photo-z estimates and SED fits.
Current usage metrics show cumulative count of Article Views (full-text article views including HTML views, PDF and ePub downloads, according to the available data) and Abstracts Views on Vision4Press platform.
Data correspond to usage on the plateform after 2015. The current usage metrics is available 48-96 hours after online publication and is updated daily on week days.
Initial download of the metrics may take a while.