Free Access
Fig. 2.
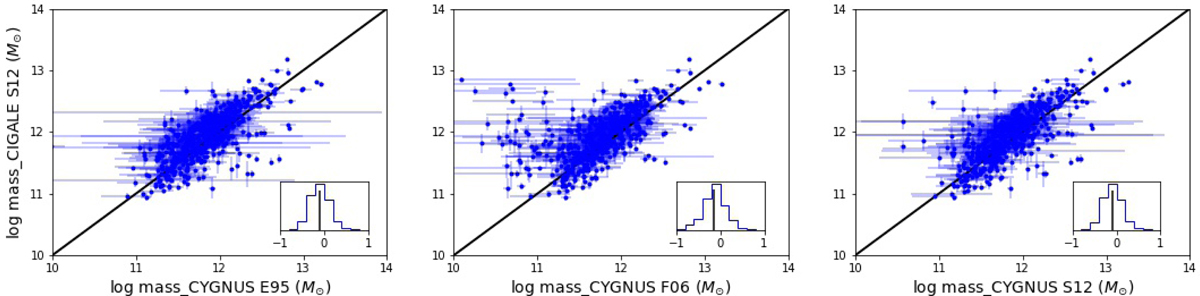
Download original image
Comparisons of stellar mass estimates derived using the CIGALE S12 model and the three AGN models in the CYGNUS runs (in the order of E95, F06, and S12). The histograms corresponding to the difference between the X- and Y-axis values are inserted in each panel.
Current usage metrics show cumulative count of Article Views (full-text article views including HTML views, PDF and ePub downloads, according to the available data) and Abstracts Views on Vision4Press platform.
Data correspond to usage on the plateform after 2015. The current usage metrics is available 48-96 hours after online publication and is updated daily on week days.
Initial download of the metrics may take a while.