Fig. 6.
Download original image
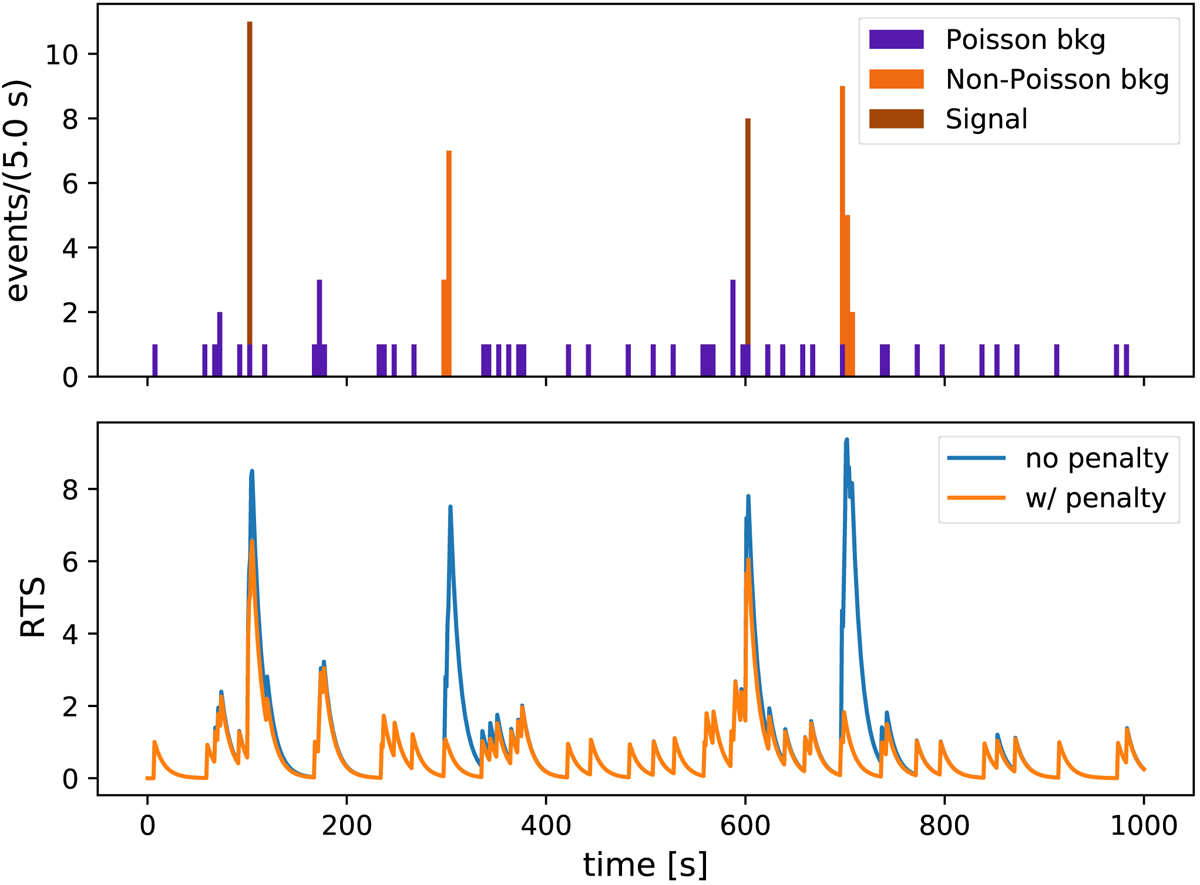
Illustration of non-Poisson rejection. Top panel: example of event rate as a function of time in a detector with the size of Super-Kamiokande. The injected Poisson background has a rate rbkg = 0.05 s−1. Two additional spatially correlated clusters of background events (with σB = 2 m) and with respectively 10 and 15 events) have been injected. Finally, two signal-like bursts with the parametrisation of Eq. (14) are added, with 7 and 10 neutrinos, respectively. Bottom panel: test statistic time evolution for the RTS2 method without and with the spatial penalty from Eq. (16).
Current usage metrics show cumulative count of Article Views (full-text article views including HTML views, PDF and ePub downloads, according to the available data) and Abstracts Views on Vision4Press platform.
Data correspond to usage on the plateform after 2015. The current usage metrics is available 48-96 hours after online publication and is updated daily on week days.
Initial download of the metrics may take a while.