Open Access
Fig. 2.
Download original image
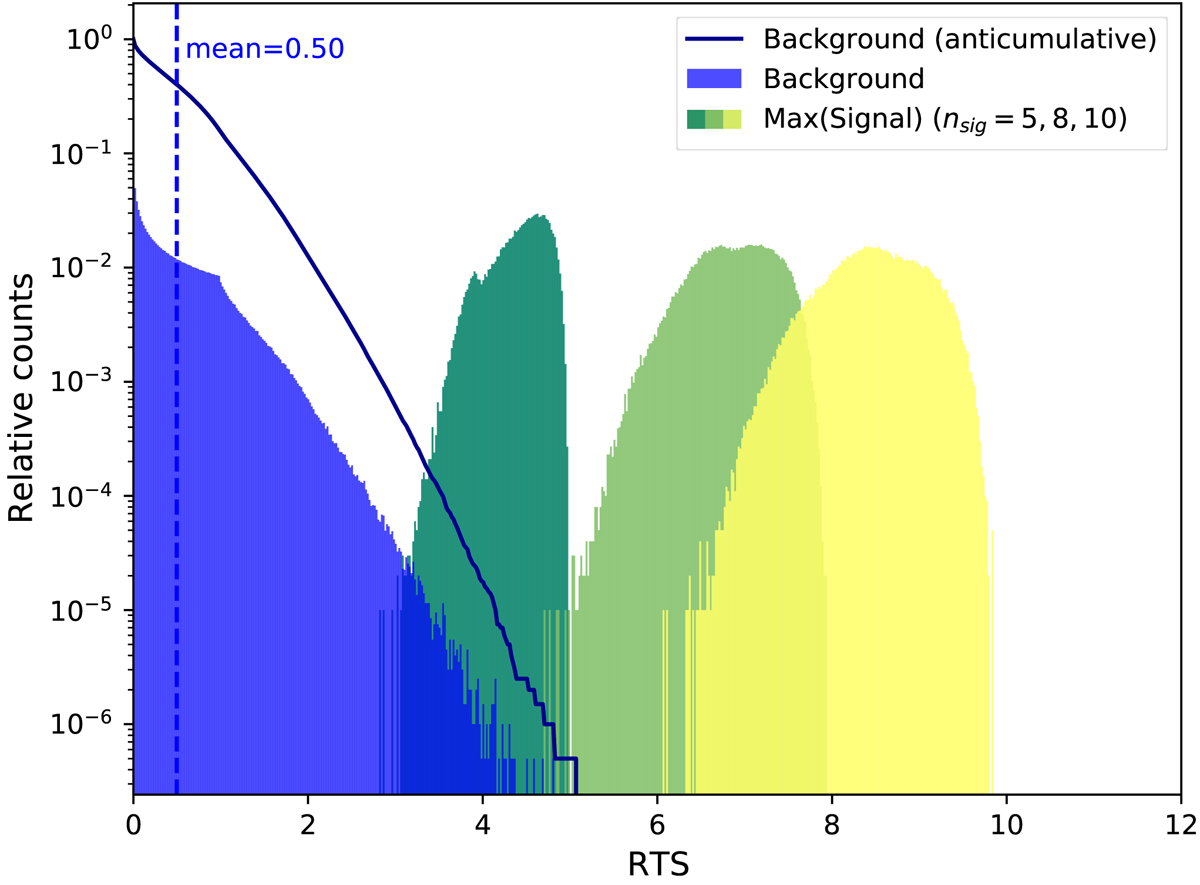
Distribution of ℱ(t), computed every second on a background simulation with Poisson rate r = 0.05 s−1 and assuming Tc = 10 s, with its corresponding anticumulative (dark blue). The signal histograms show the distributions of the maximal ℱ values obtained for a signal injection of 5, 8, or 10 events (τ1 = 1 s, τ2 = 0.01 s).
Current usage metrics show cumulative count of Article Views (full-text article views including HTML views, PDF and ePub downloads, according to the available data) and Abstracts Views on Vision4Press platform.
Data correspond to usage on the plateform after 2015. The current usage metrics is available 48-96 hours after online publication and is updated daily on week days.
Initial download of the metrics may take a while.