Fig. 8.
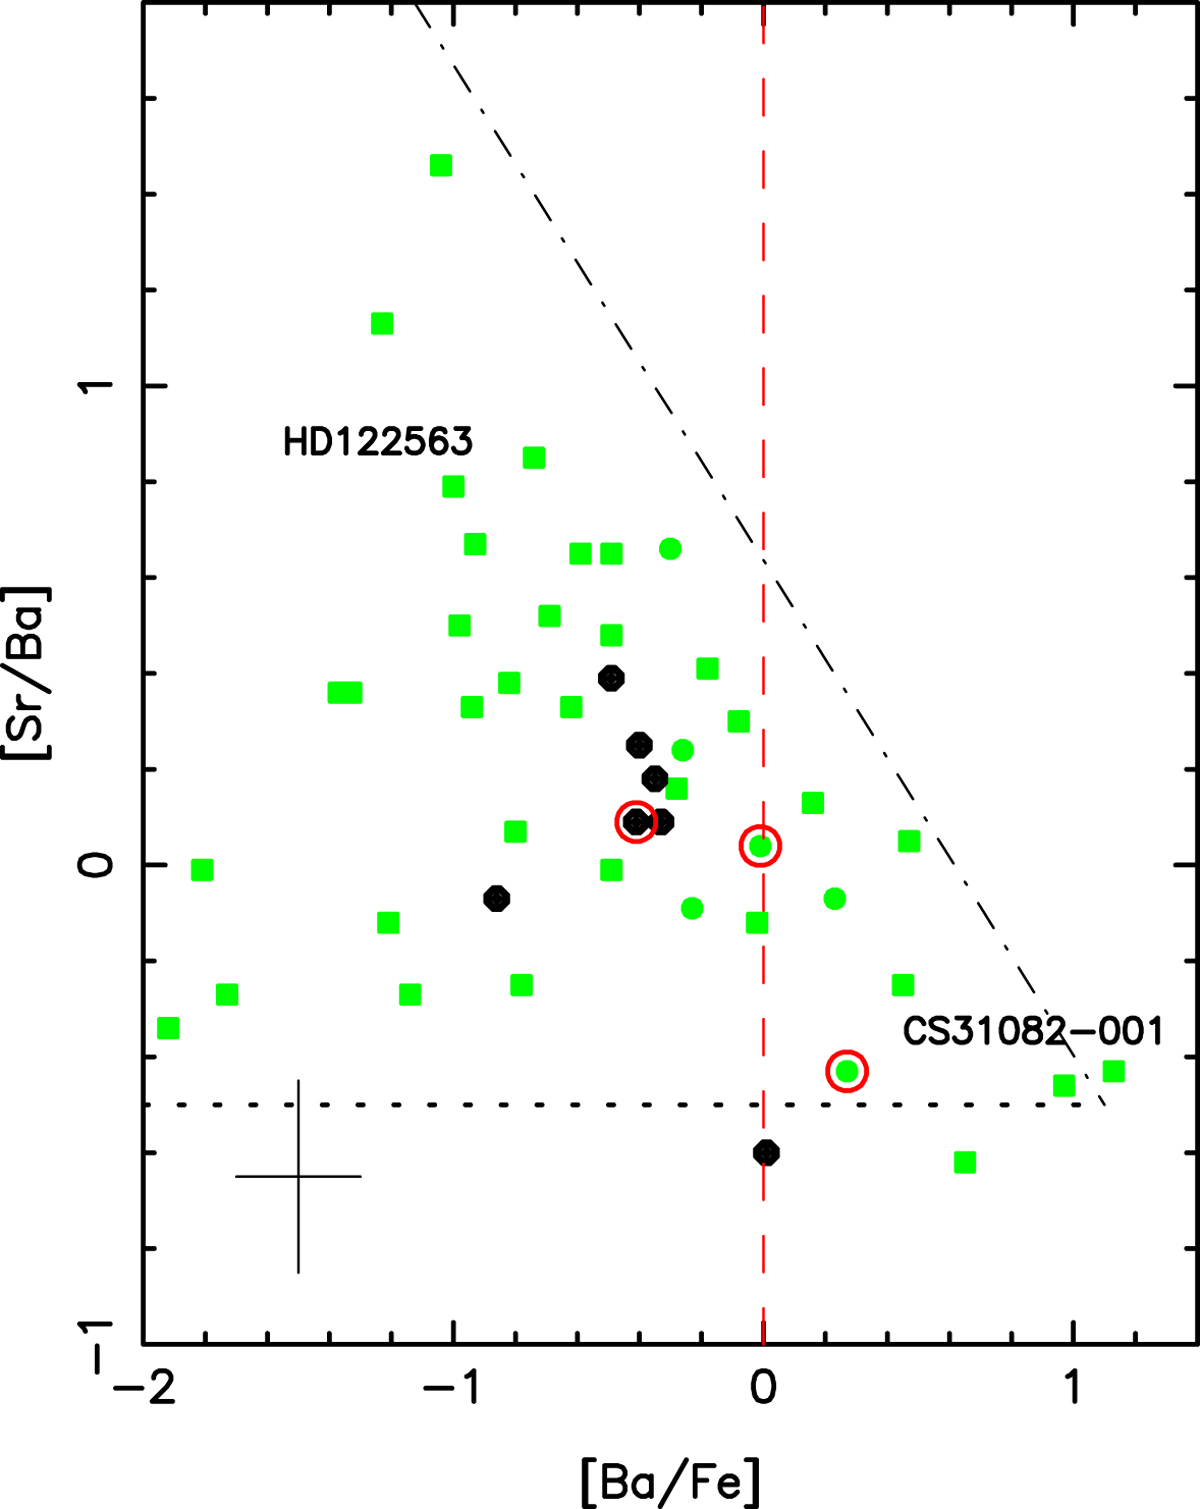
Download original image
[Sr/Ba] vs. [Ba/Fe]. Green symbols represent the First Stars, circles show dwarfs, and squares show giants. The black dots represent our sample of dwarfs (Ba could be measured in only seven stars of the sample). The three Li-poor dwarf stars (with a measured Ba abundance) are circled in red. The dotted line represents the value [Sr/Ba] provided by the r-process alone. CS 31082-001 is a typical r-rich star, and in contrast, HD 122563, is an r-poor star with a relative enrichment of the first peak elements.
Current usage metrics show cumulative count of Article Views (full-text article views including HTML views, PDF and ePub downloads, according to the available data) and Abstracts Views on Vision4Press platform.
Data correspond to usage on the plateform after 2015. The current usage metrics is available 48-96 hours after online publication and is updated daily on week days.
Initial download of the metrics may take a while.