Free Access
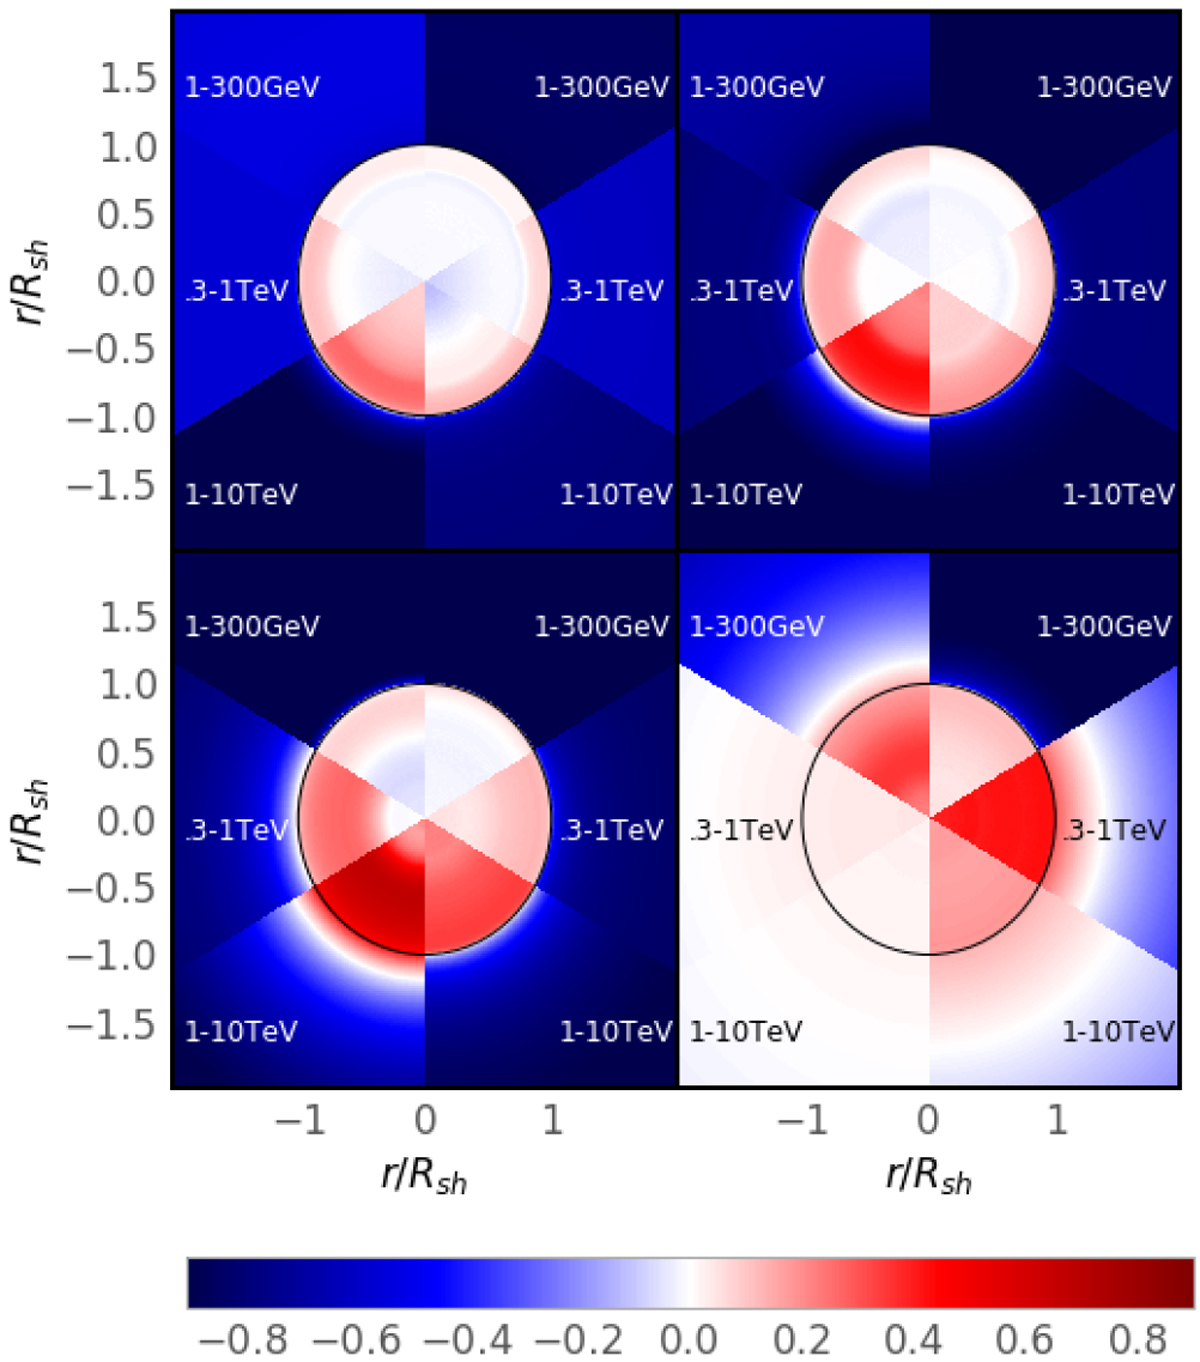
Fig. 5
Download original image
Maps of spectral-index variation in three energy bands at 300, 1000, 2000 and 10 000 yr (from top left to bottom right), relative to the average spectral index of the remnant (including the halo). Left hemispheres are inverse-Compton emission and right hemispheres Pion-decay emission.
Current usage metrics show cumulative count of Article Views (full-text article views including HTML views, PDF and ePub downloads, according to the available data) and Abstracts Views on Vision4Press platform.
Data correspond to usage on the plateform after 2015. The current usage metrics is available 48-96 hours after online publication and is updated daily on week days.
Initial download of the metrics may take a while.