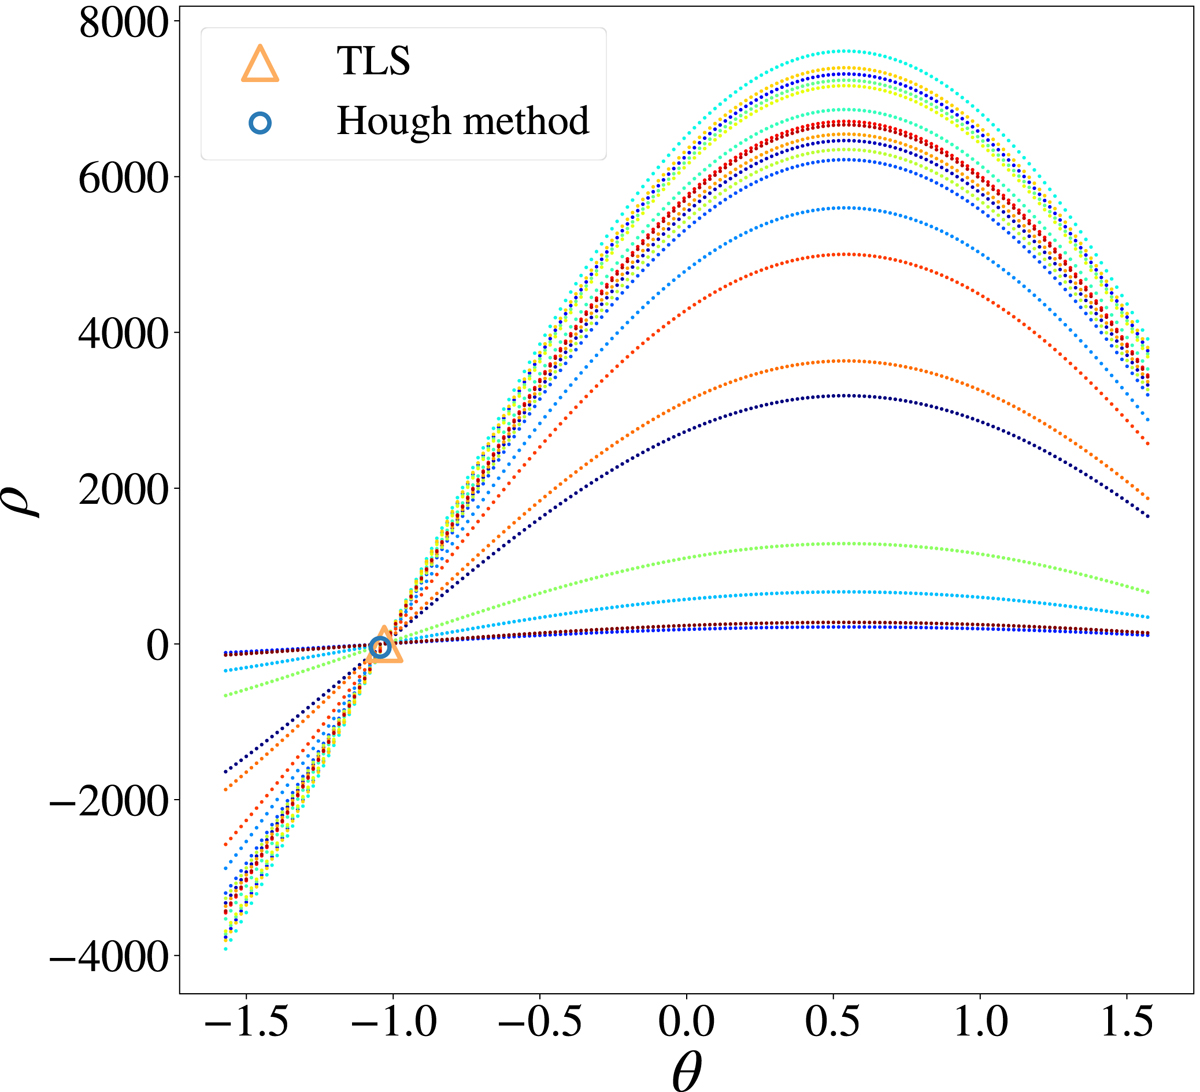
Fig. A.2.
Download original image
Hough parameter space for the case of data points arranged in a perfect line. Each colored curve corresponds to one data point in the image space. There is exactly one point where all curves cross, marking the parameter pair which optimally describes the linear relationship. Both the Hough method (blue circle) and the TLS method (orange triangle) find this point.
Current usage metrics show cumulative count of Article Views (full-text article views including HTML views, PDF and ePub downloads, according to the available data) and Abstracts Views on Vision4Press platform.
Data correspond to usage on the plateform after 2015. The current usage metrics is available 48-96 hours after online publication and is updated daily on week days.
Initial download of the metrics may take a while.