Free Access
Fig. A.1.
Download original image
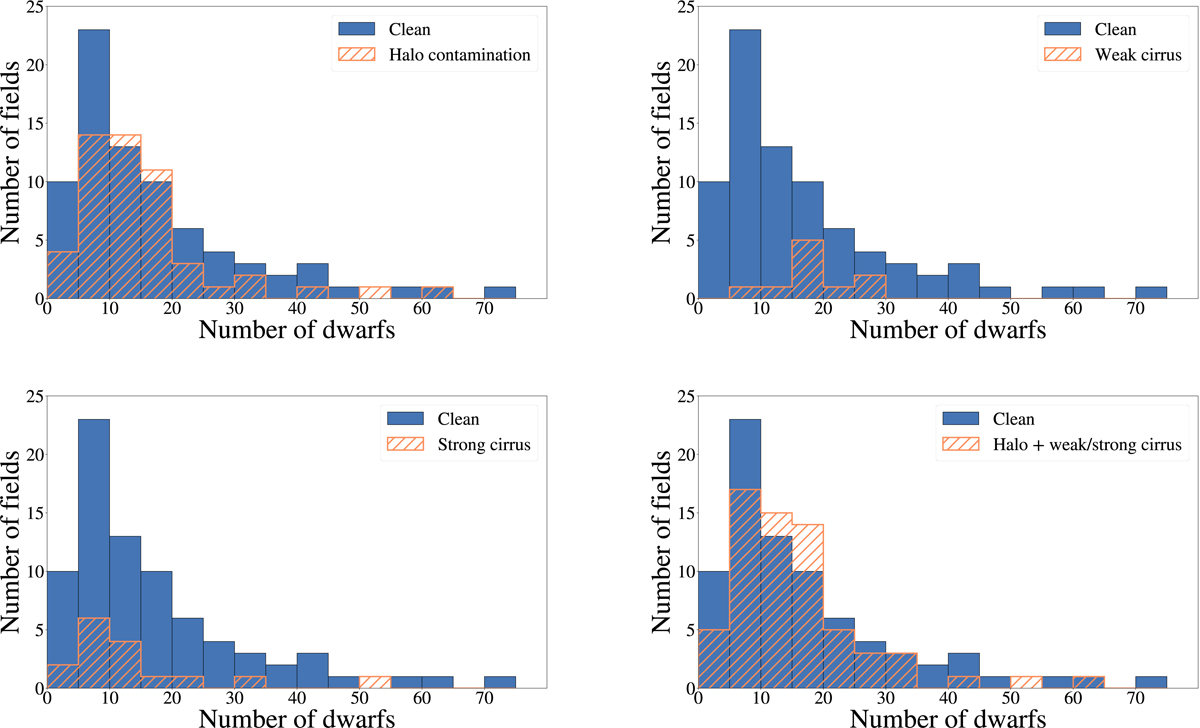
Number distributions of dwarfs detected in clean fields (blue bars) and in fields affected (orange dashed) by halos (top left), weak cirrus (top right), strong cirrus (bottom left), and all forms of contamination (bottom right).
Current usage metrics show cumulative count of Article Views (full-text article views including HTML views, PDF and ePub downloads, according to the available data) and Abstracts Views on Vision4Press platform.
Data correspond to usage on the plateform after 2015. The current usage metrics is available 48-96 hours after online publication and is updated daily on week days.
Initial download of the metrics may take a while.