Fig. A.4.
Download original image
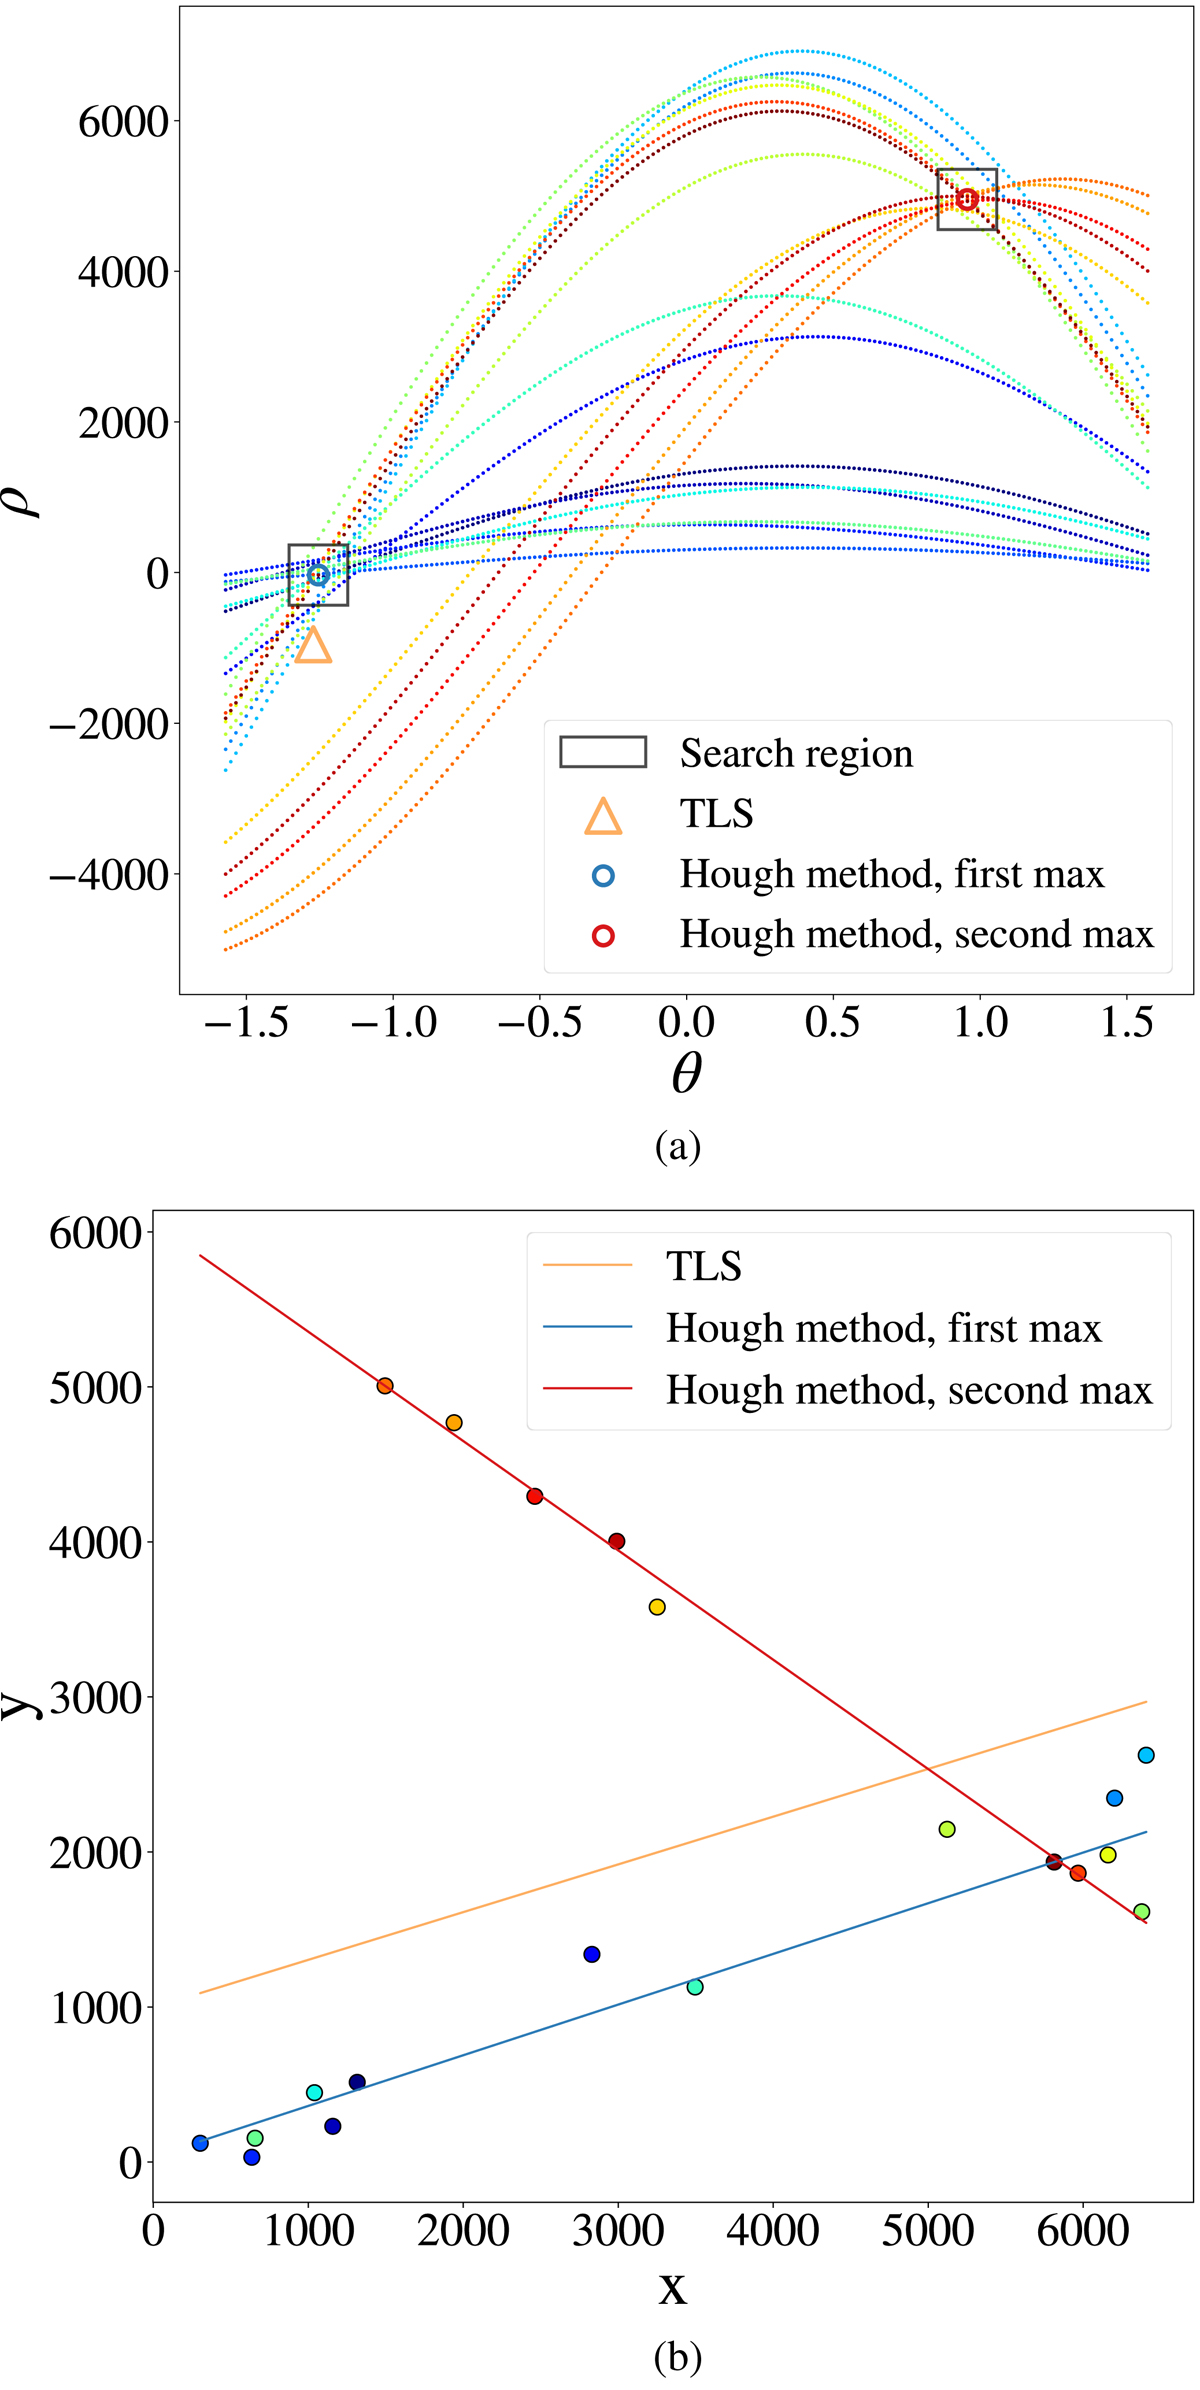
(a) Curves corresponding to votes of data points in Hough space. Each curve results from the calculation of parameters using Eq. (A.1). The areas with the most crossings show the parameter pairs fitting two linear scatters. The black rectangle shows the search area for the maxima. For every point the number of different neighbors within are counted. Each point can vote for the two different fits. The blue and red circle show the first and second maxima, respectively. The orange triangle shows the parameter location of a TLS fit on the data points. (b) Scatter plot showing two randomly generated linear scatters fitted via the Hough method. The blue and red lines show the first and second detected regions of maximal crossings in parameter space. The orange line shows a TLS fit on the data points. The colors of the data points correspond to the ones of the lines in plot (a).
Current usage metrics show cumulative count of Article Views (full-text article views including HTML views, PDF and ePub downloads, according to the available data) and Abstracts Views on Vision4Press platform.
Data correspond to usage on the plateform after 2015. The current usage metrics is available 48-96 hours after online publication and is updated daily on week days.
Initial download of the metrics may take a while.