Fig. A.3.
Download original image
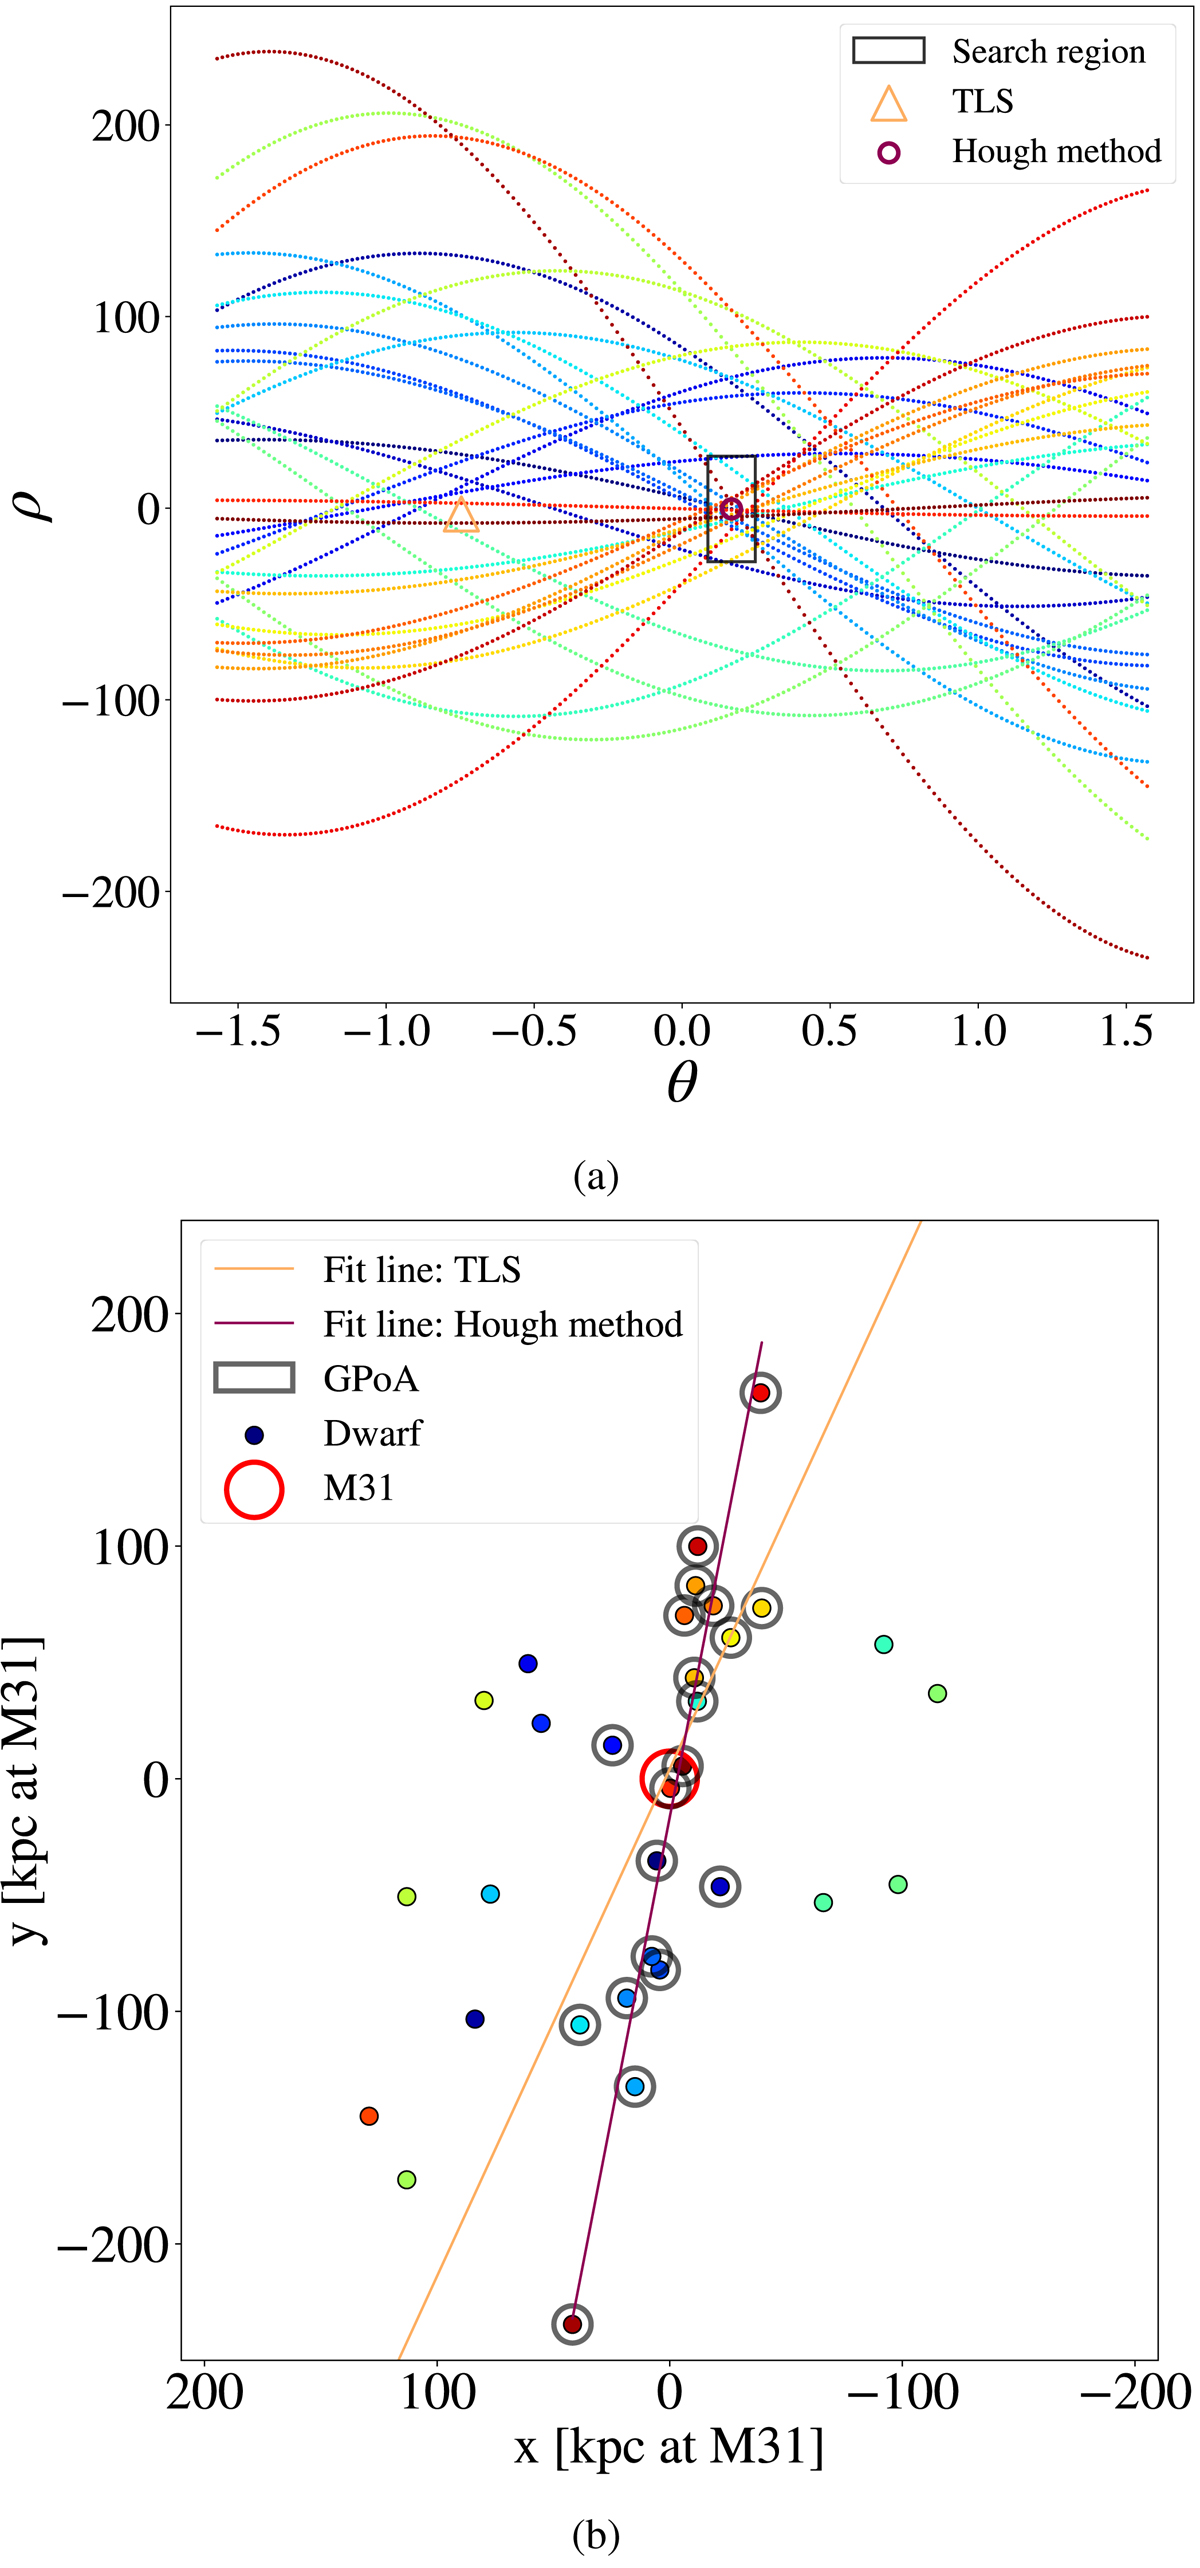
(a) M31 dwarfs in the Hough parameter space. Each curve results from the calculation of parameters using Eq. (A.1). The densest crossing region shows the parameter pair fitting the majority of the data. The black rectangle shows the size of the search area. The magenta circle points to the parameter pair which best describes the clustered substructure. The orange triangle shows the parameter location of a TLS fit on the data points. (b) Scatter plot showing the M31 (red circle) satellite system in right ascension and declination. The orange line shows a TLS fit on the data points. The magenta line is the fit produced by the Hough method. The dwarfs circled in gray are members of the GPoA and at the same time voted for the best fit parameters. The colors of the data points correspond to the ones of the lines in plot (a).
Current usage metrics show cumulative count of Article Views (full-text article views including HTML views, PDF and ePub downloads, according to the available data) and Abstracts Views on Vision4Press platform.
Data correspond to usage on the plateform after 2015. The current usage metrics is available 48-96 hours after online publication and is updated daily on week days.
Initial download of the metrics may take a while.