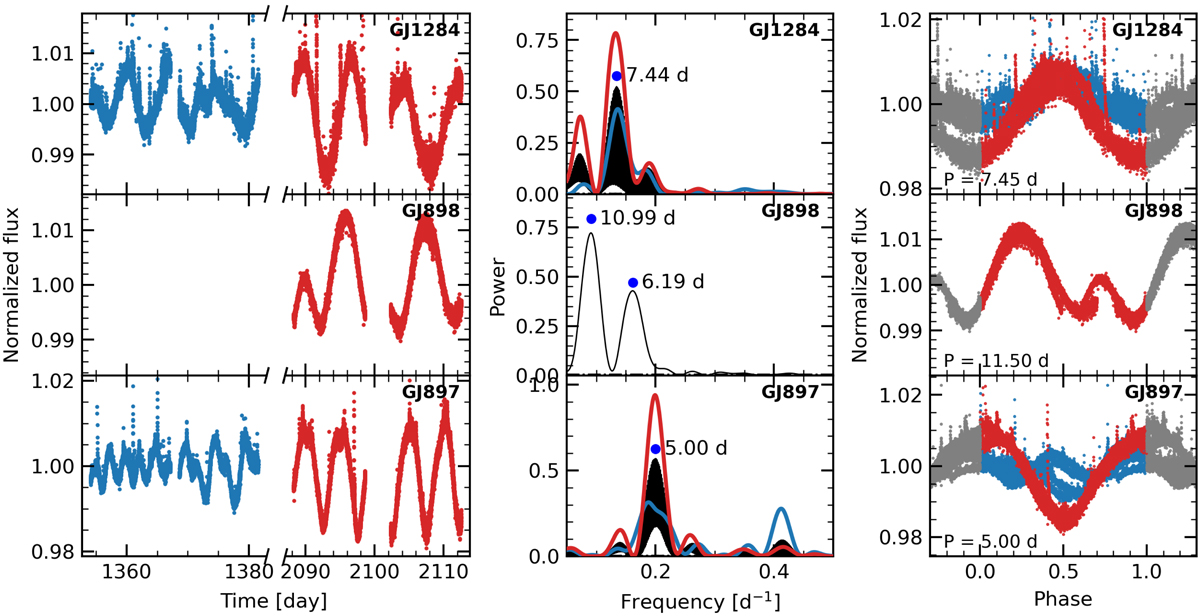
Fig. 7.
Download original image
TESS light curves and periodograms of GJ 1284 (top), GJ 898 (middle) and GJ 897 (bottom). Left: TESS photometric time series. Middle: GLS periodogram of the photometric time series. Right: light curve phase-folded with the selected rotation periods in Table 2. We adjust the ordinate axis range to crop the stellar flares to better visualise the variations in the light curve due to the stellar rotation. The colours in all the panels correspond to data from Sector 2 (blue) or Sector 29 (red) or both combined (black).
Current usage metrics show cumulative count of Article Views (full-text article views including HTML views, PDF and ePub downloads, according to the available data) and Abstracts Views on Vision4Press platform.
Data correspond to usage on the plateform after 2015. The current usage metrics is available 48-96 hours after online publication and is updated daily on week days.
Initial download of the metrics may take a while.