Fig. 13.
Download original image
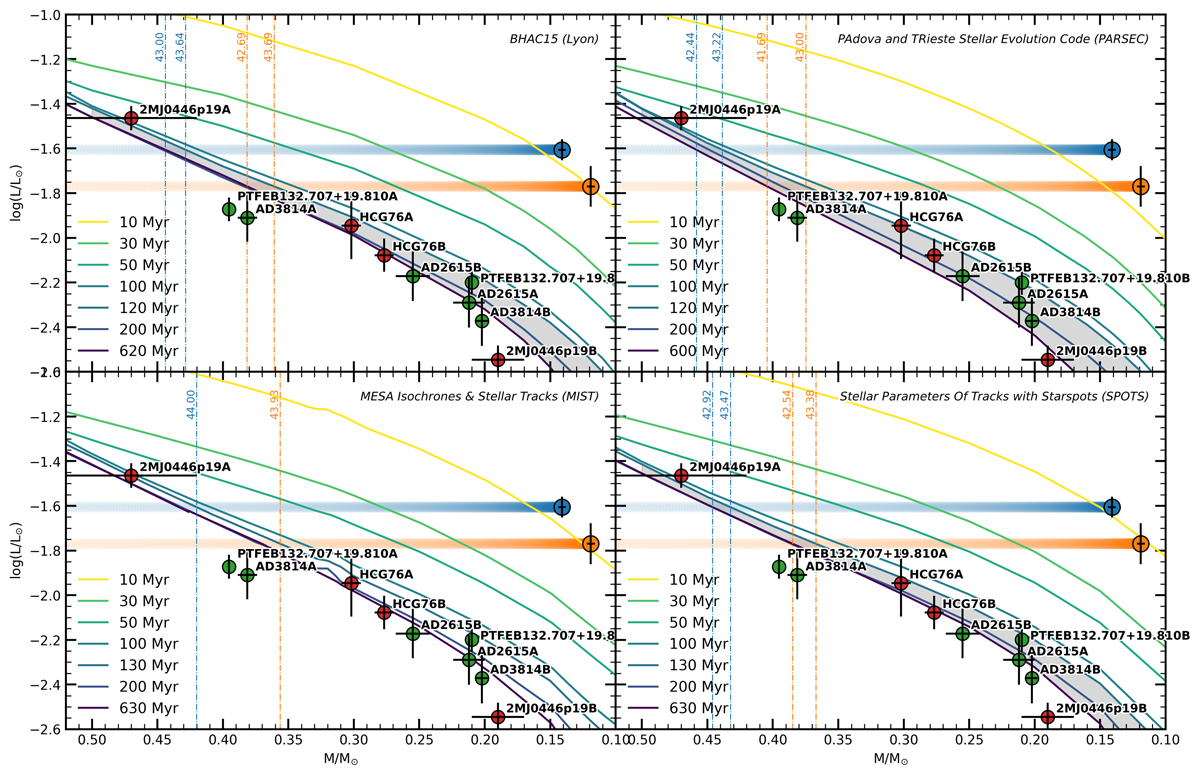
Minimum masses and luminosities of GJ 1284 A (blue) and B (orange) against the mass-luminosity relations derived from the BHAC15 (top left), PARSEC (top right), MIST (bottom left), and SPOTS (bottom right) models. The blue and orange horizontal bars represent the expected masses at different inclination angles for the primary and the secondary components, respectively. The dashed vertical lines indicate the masses derived from the mass-luminosity relations for the minimum and maximum ages derived from the youth indicators (shaded in grey). For comparison, we overplot the dynamical masses of the EB members of NGC 1647, the Pleiades (red) and Praesepe (green) open clusters from Lodieu et al. (2020).
Current usage metrics show cumulative count of Article Views (full-text article views including HTML views, PDF and ePub downloads, according to the available data) and Abstracts Views on Vision4Press platform.
Data correspond to usage on the plateform after 2015. The current usage metrics is available 48-96 hours after online publication and is updated daily on week days.
Initial download of the metrics may take a while.