Fig. 2.
Download original image
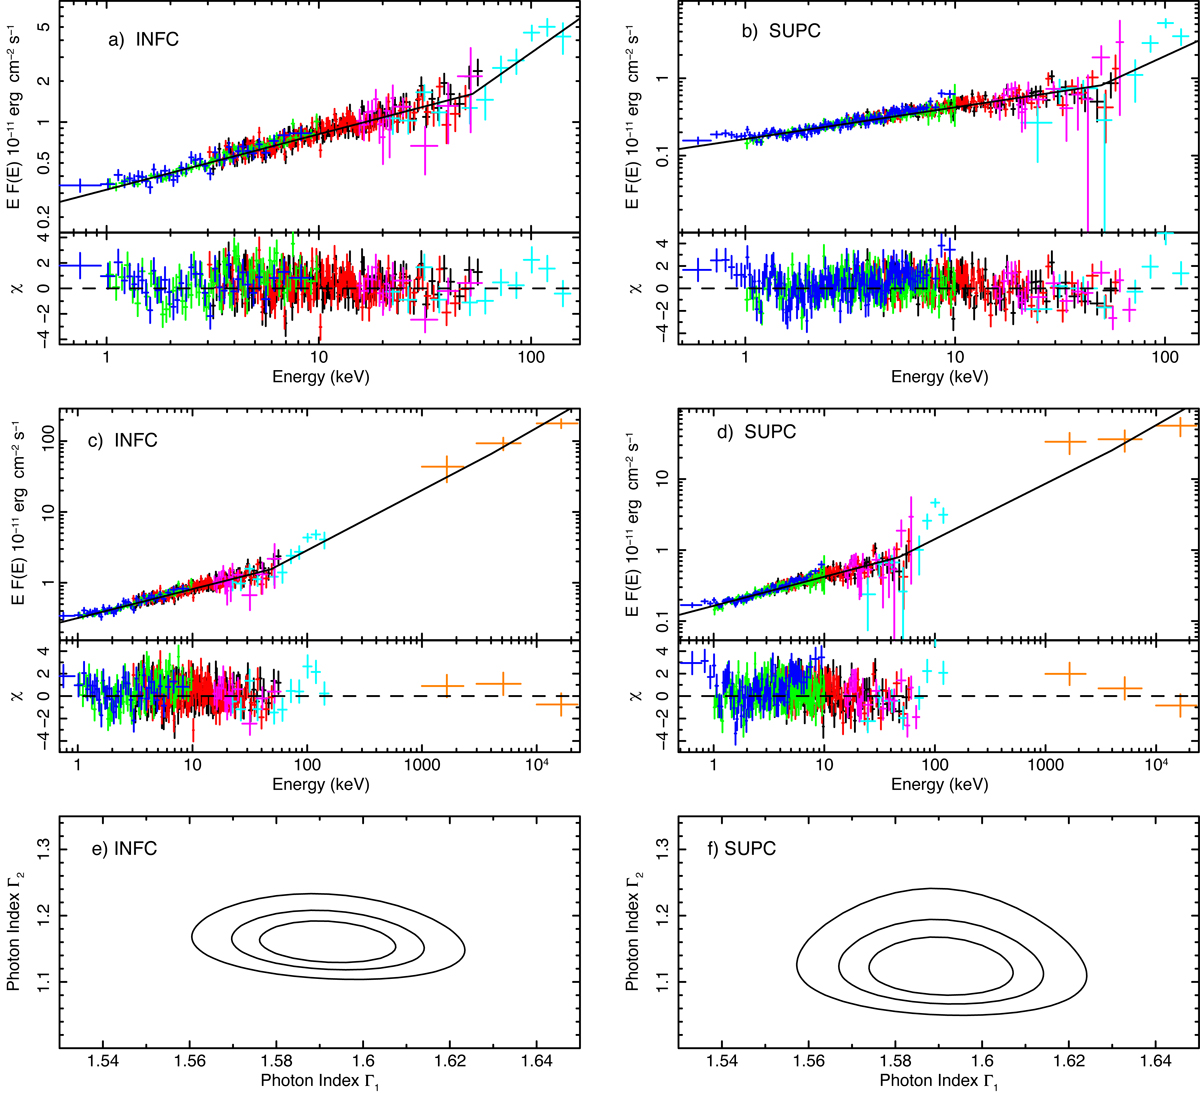
(a) and (b) are the unfolded absorbed broad-band spectra of LS 5039 in the 0.5–250 keV energy range and separated in the INFC and SUPC phases. (c) and (d) include the COMPTEL data and thus cover the 0.5–2 × 10⁴ keV energy range. The data points are obtained from the XMM-Newton/MOS (blue points, 0.5–9 keV), the NuSTAR/FPMA/FPMB (black/red points, 3–79 keV) Suzaku/XIS/HXD (green and magenta points, 1–10 keV and 10–70 keV, respectively), INTEGRAL/ISGRI (cyan points, 24–250 keV), and COMPTEL (orange points, 1–30 MeV). The fit represented in the top panels with a solid line was obtained with the bknpow model. The residuals from the best fits are shown in the lower panels. (e) and (f) are the contours corresponding to the spectral fit (c) and (d) of the broken power-law indices separated in the INFC and SUPC phases, respectively.
Current usage metrics show cumulative count of Article Views (full-text article views including HTML views, PDF and ePub downloads, according to the available data) and Abstracts Views on Vision4Press platform.
Data correspond to usage on the plateform after 2015. The current usage metrics is available 48-96 hours after online publication and is updated daily on week days.
Initial download of the metrics may take a while.