Fig. A.1
Download original image
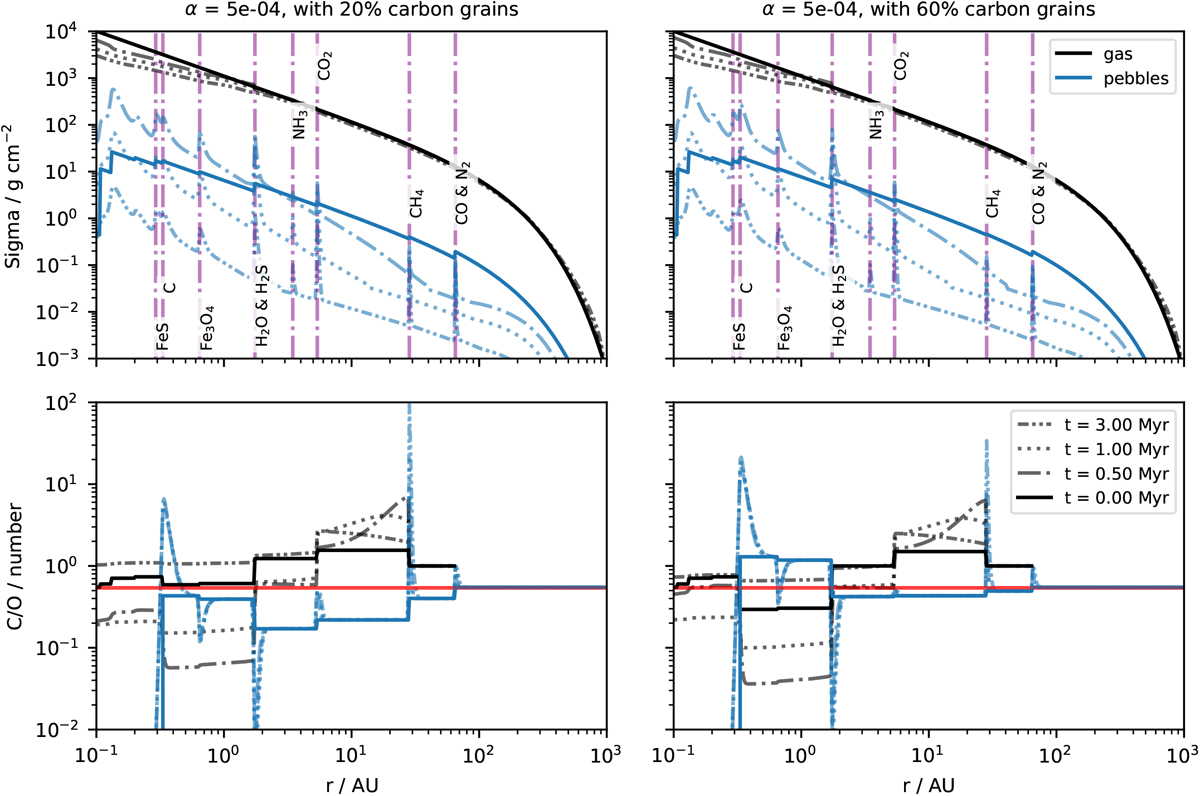
Disk evolution (top) for α = 5 × 10⁻⁴ and the corresponding C/O ratio in gas and pebbles (bottom). The left panels display models with 20% of the carbon abundance locked in refractory carbon grains, whereas the right panels show models with 60% locked in carbon grains. The red linein the bottom panel marks the solar C/O.
Current usage metrics show cumulative count of Article Views (full-text article views including HTML views, PDF and ePub downloads, according to the available data) and Abstracts Views on Vision4Press platform.
Data correspond to usage on the plateform after 2015. The current usage metrics is available 48-96 hours after online publication and is updated daily on week days.
Initial download of the metrics may take a while.