Fig. 4
Download original image
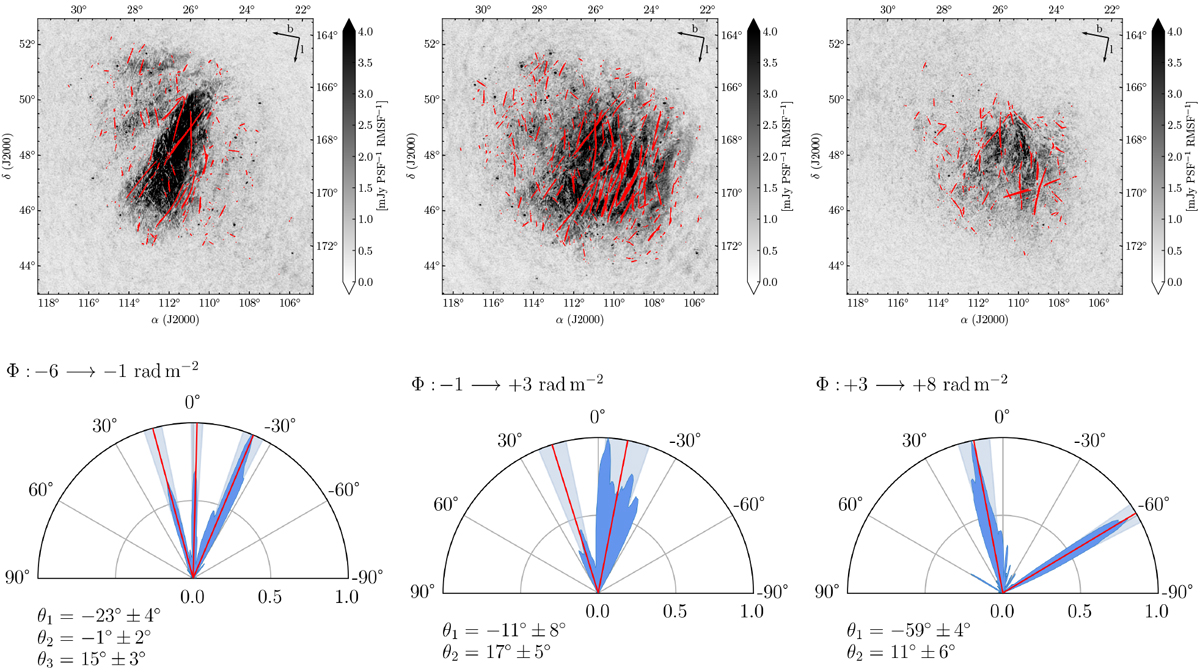
RHT analysis performed on inverted maximum intensity images of Field A divided into three different Faraday-depth ranges. The upper part of the figure shows the results of the RHT analysis as weighted RHT back-projections (red lines) plotted over the maximum polarised intensity images. The lower part of the figure shows half-polar plots for the corresponding RHT back-projections, scaled according to their maximum. The Galactic plane orientation is at 0°. Red lines mark the averages of distinctive orientations, and light blue areas span the spread of the distributions for the corresponding averaged values.
Current usage metrics show cumulative count of Article Views (full-text article views including HTML views, PDF and ePub downloads, according to the available data) and Abstracts Views on Vision4Press platform.
Data correspond to usage on the plateform after 2015. The current usage metrics is available 48-96 hours after online publication and is updated daily on week days.
Initial download of the metrics may take a while.