Fig. 11
Download original image
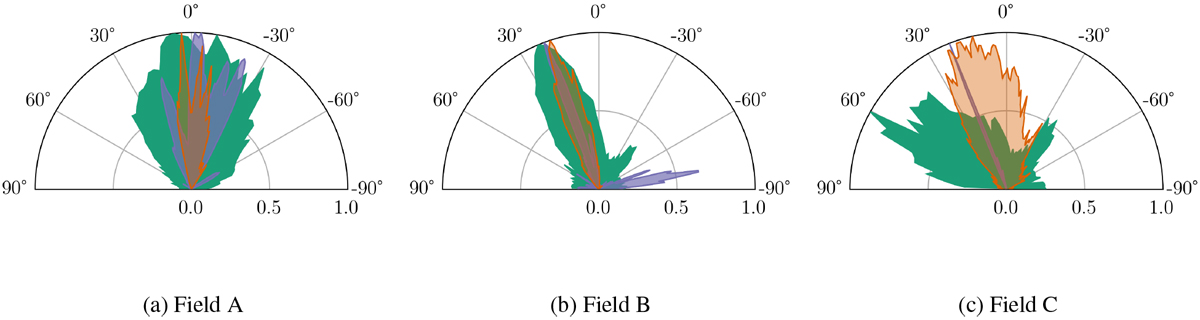
Summary of the results (see Figs. 4–8) showing the comparison of the orientations of the depolarisation canals (purple distribution), the HI filaments (green distribution), and the plane-of-the-sky magnetic field component (orange distribution) in relative scale. For Field A,we summed RHT results for depolarisation canals identified across the three Faraday-depth ranges given in Fig. 4.
Current usage metrics show cumulative count of Article Views (full-text article views including HTML views, PDF and ePub downloads, according to the available data) and Abstracts Views on Vision4Press platform.
Data correspond to usage on the plateform after 2015. The current usage metrics is available 48-96 hours after online publication and is updated daily on week days.
Initial download of the metrics may take a while.