Fig. 10
Download original image
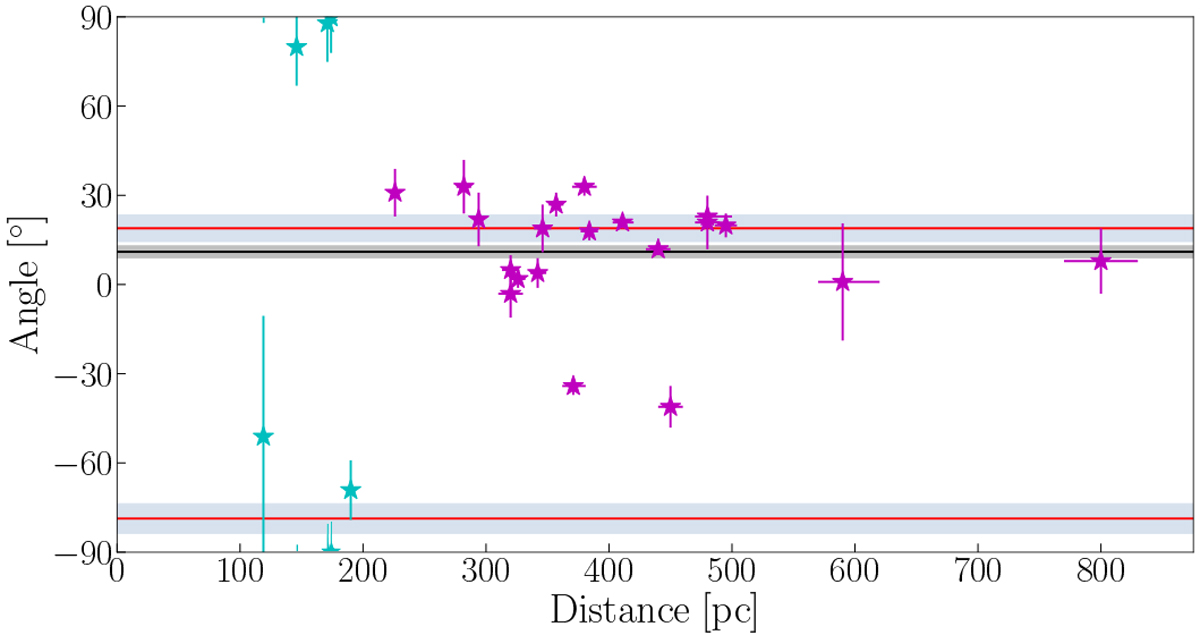
Angles vs. distance plot for Field B. The angle on the y-axis denotes the polarisation angle of the stars as well as the angle distribution of the depolarisation canals. The x-axis denotes the distance to the stars. Horizontal red lines mark the averages of distinctive orientations of the depolarisation canals, and light blue areas span the spread of the distributions for the corresponding averaged values, the same as in Fig. 5 with two peaks ~ 100° apart. The colours of the stars correspond to the same groups of stars shown in Fig. 9. We can freely shift the polarisation angles of the stars modulo π, meaning that the three stars plotted near 90° could also belong to the area below − 90° around the negative peak of the angle distribution of the depolarisation canals. The horizontal black line marks the average true value of the polarisation angle for the background stars, and the grey area spans the error range.
Current usage metrics show cumulative count of Article Views (full-text article views including HTML views, PDF and ePub downloads, according to the available data) and Abstracts Views on Vision4Press platform.
Data correspond to usage on the plateform after 2015. The current usage metrics is available 48-96 hours after online publication and is updated daily on week days.
Initial download of the metrics may take a while.