Free Access
Fig. 5.
Download original image
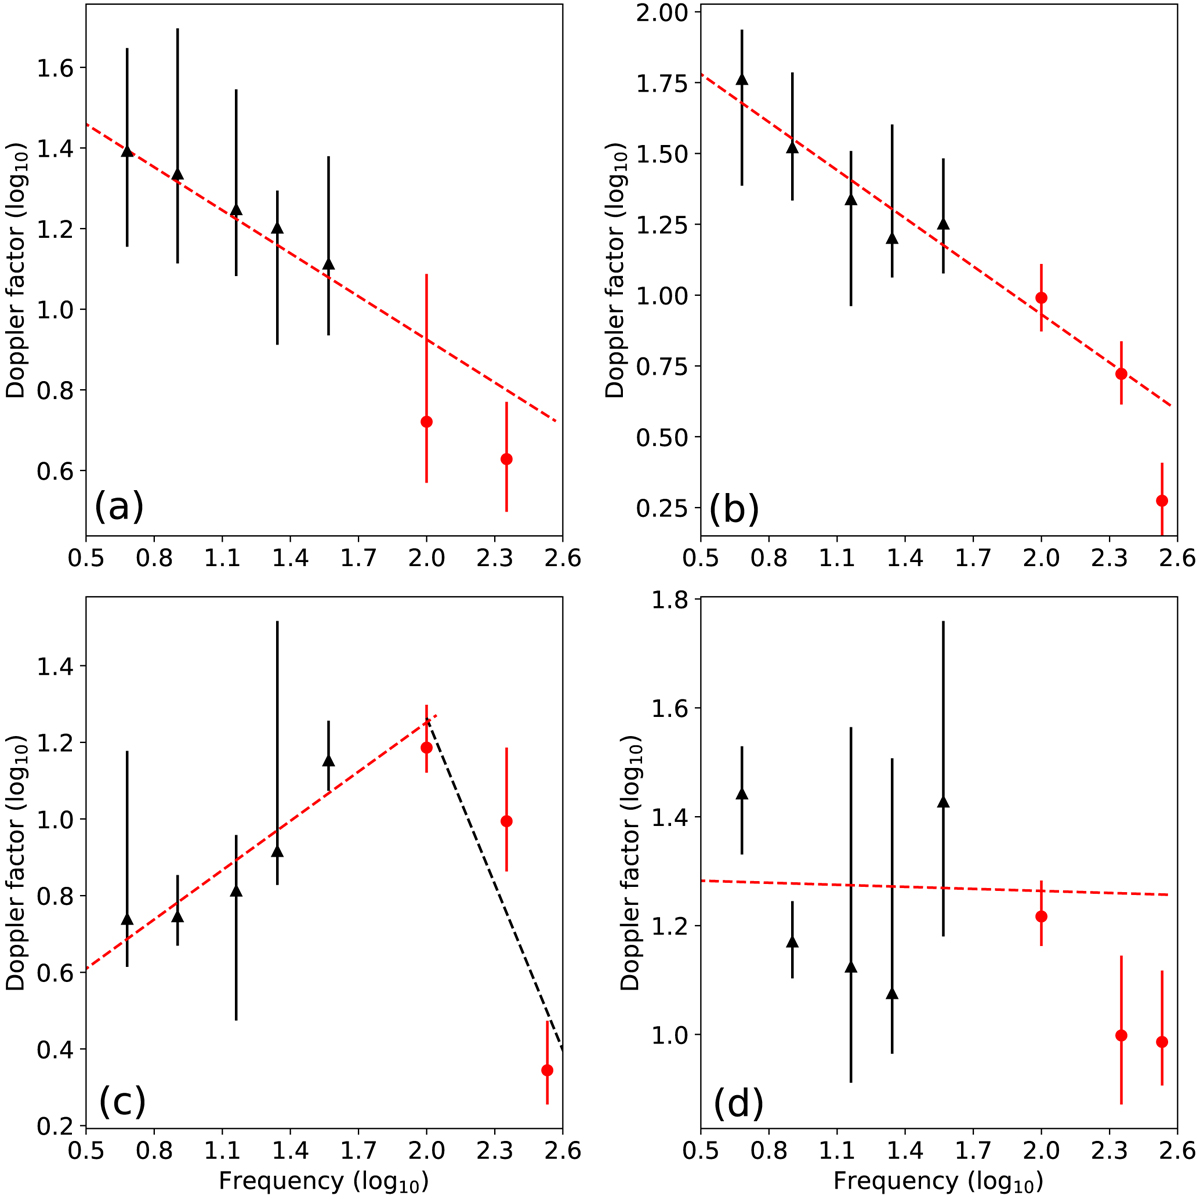
Doppler factor versus frequency in log–log space for 0234+285 (panel a) 0420–014 (panel b), 1253–055 (panel c), and 2251+158 (panel d). The red dashed line shows the best-fit relation estimated in the 4.8–37 GHz range. The dashed black line in panel c is the best-fit relation estimated in the 100–350 GHz range.
Current usage metrics show cumulative count of Article Views (full-text article views including HTML views, PDF and ePub downloads, according to the available data) and Abstracts Views on Vision4Press platform.
Data correspond to usage on the plateform after 2015. The current usage metrics is available 48-96 hours after online publication and is updated daily on week days.
Initial download of the metrics may take a while.