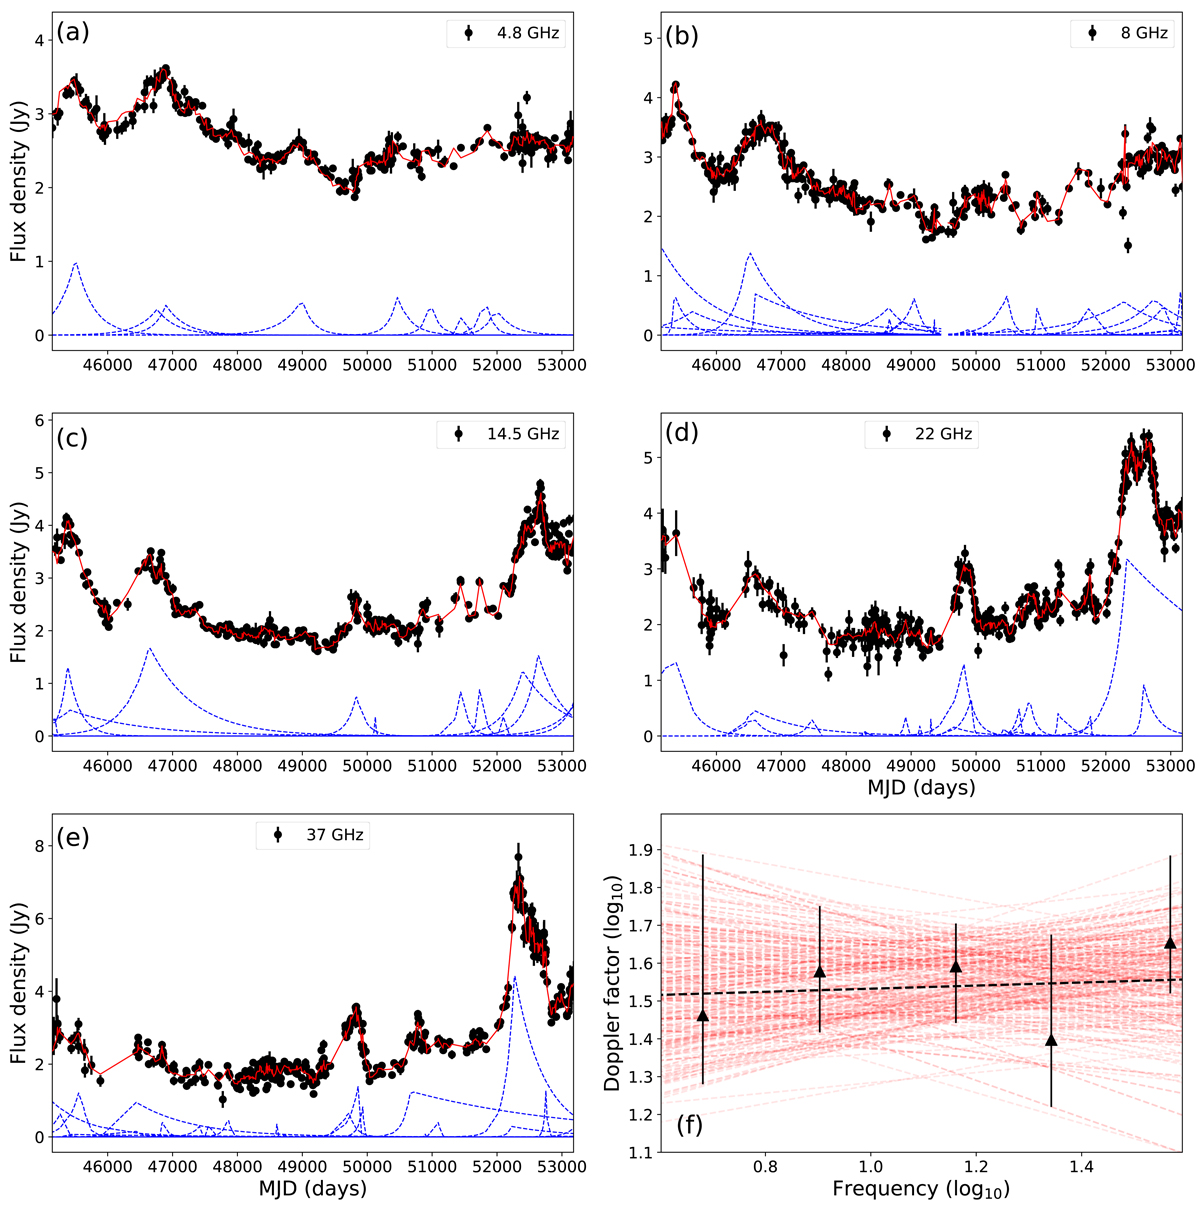
Fig. 1.
Download original image
Example of light-curve fitting for 1633+382 for all frequencies (panels a–e). The red solid line shows the overall fit in each panel, whereas the blue lines show one randomly selected realization of the flares after subtraction of the background. Here we only consider flares from June 1982 to June 2004. Panel f: Doppler factor versus frequency relation in log–log space. The black dashed line shows the best-fit line, and the red dashed lines show the uncertainty of the fit by randomly drawing from the joint posterior distribution of the slope (S) and intercept (I).
Current usage metrics show cumulative count of Article Views (full-text article views including HTML views, PDF and ePub downloads, according to the available data) and Abstracts Views on Vision4Press platform.
Data correspond to usage on the plateform after 2015. The current usage metrics is available 48-96 hours after online publication and is updated daily on week days.
Initial download of the metrics may take a while.