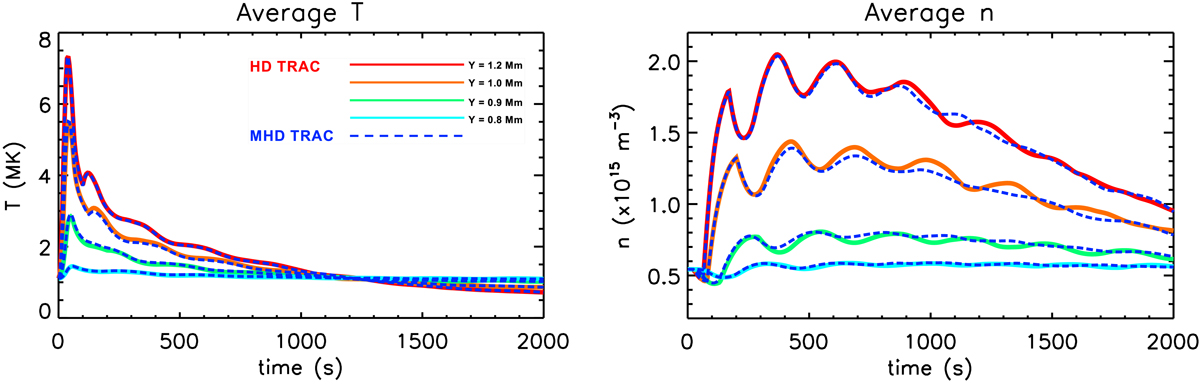
Fig. 5.
Download original image
Comparison of the coronal evolution obtained from the two different models of the unsheared arcade (Sect. 4.1), in response to the non-uniform coronal heating pulse. The panels show the coronal averaged temperature and density as functions of time, at four different positions across the magnetic field. The various solid curves represent the HD TRAC solution at these different transverse locations (with the lines colour coded in a way that reflects the distance across the field from the centre of the arcade) and the dashed blue curves correspond to the MHD TRAC solution at these locations.
Current usage metrics show cumulative count of Article Views (full-text article views including HTML views, PDF and ePub downloads, according to the available data) and Abstracts Views on Vision4Press platform.
Data correspond to usage on the plateform after 2015. The current usage metrics is available 48-96 hours after online publication and is updated daily on week days.
Initial download of the metrics may take a while.