Fig. 4.
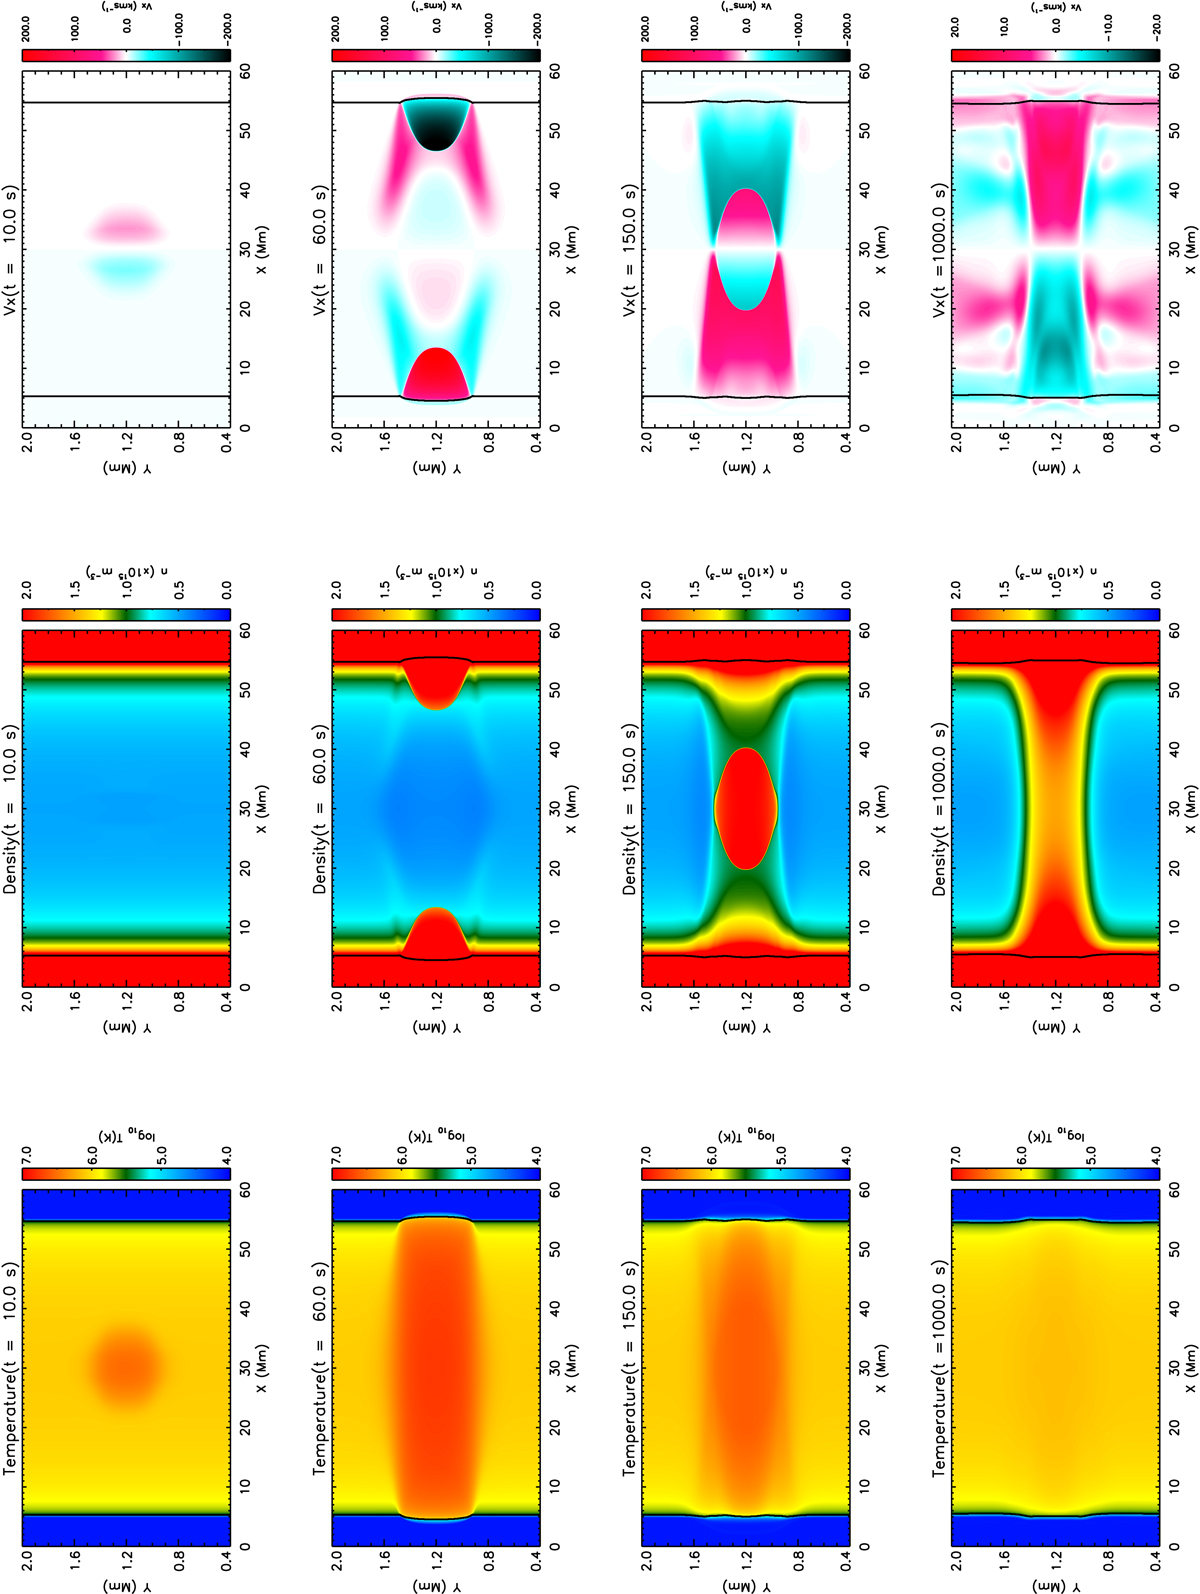
Download original image
Results for the non-uniform coronal heating pulse using a two-dimensional MHD simulation of the unsheared arcade (Sect. 4.1). Starting from the left, the columns show time ordered snapshots of the temperature (T), density (n) and field-aligned velocity (vx) for times during the heating, evaporation and decay phases. The contours are drawn according to the scales shown in the colour tables. The black curves indicate the top of the TRAC region at each of the footpoints of the unsheared arcade. Movies of the full time evolution of the T, n and vx contour plots can be viewed online.
Current usage metrics show cumulative count of Article Views (full-text article views including HTML views, PDF and ePub downloads, according to the available data) and Abstracts Views on Vision4Press platform.
Data correspond to usage on the plateform after 2015. The current usage metrics is available 48-96 hours after online publication and is updated daily on week days.
Initial download of the metrics may take a while.